This visual Data Story is based on findings from the 2025 Annual Survey of Museum-Goers, a national survey of American museum visitors from AAM and Wilkening Consulting. Every year, the survey partners with individual museums to research their audiences and yield insights about their behaviors and preferences, both on an institutional and national level. (Learn more about the purpose and methodology of the survey here.) Interested in joining the 2026 edition? Sign up by December 1 to unlock a special early bird rate!

DEAI. It has been in the news quite a bit lately. The political discourse around the topic has been heated, to say the least.
But do the political pressures on DEAI reflect shifts in public opinion?
The short answer is no. They don’t.
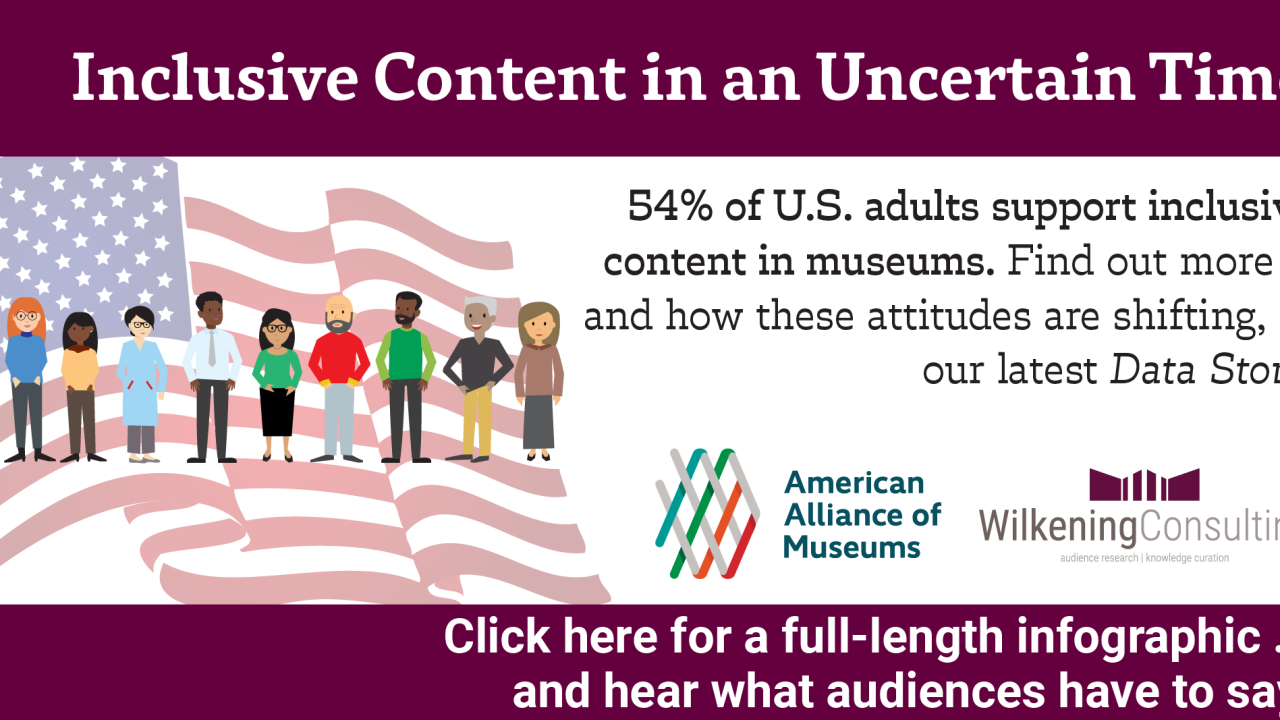
The majority of U.S. adults, and the majority of museum-goers, support and want museums to share inclusive content. This has not changed. What has changed is the political environment.
The Annual Survey of Museum-Goers has been tracking public opinions about inclusive content since 2021. We do this through a battery of three questions. Our language deliberately uses the word “inclusive,” and gives as examples content about “women, people of color, religious minorities, and LGBTQ+ people.”
(You can learn more about our methodology in our Data Story “The Spectrum of Inclusive Attitudes: Methodology.”)
We’ve been tracking results from two samples:
- Frequent museum-goers (people who visit/engage with museums frequently and responded to a museum’s request to take a survey on their behalf)
- A demographically representative sample of U.S. adults
Since 2021, inclusive attitudes among frequent museum-goers really have not budged, though the anti-inclusive side has increased slightly.
2021 – Frequent Museum-Goers:
2025 – Frequent Museum-Goers:

Why don’t the percentages always add up to 100? Well, our numbers are estimates based off of responses to three questions, which we round to whole numbers…sometimes it adds up to 101, or 98. That’s the nature of the work!
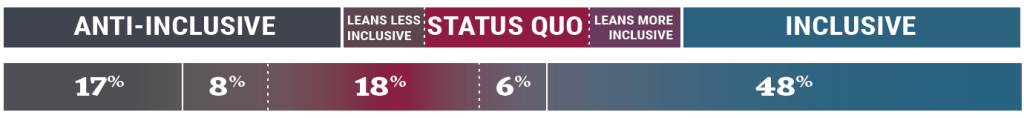
But attitudes among our demographically representative samples of U.S. adults indicate a significant overall shift towards inclusion.
2021 – U.S. Adults:

2025 – U.S. Adults:

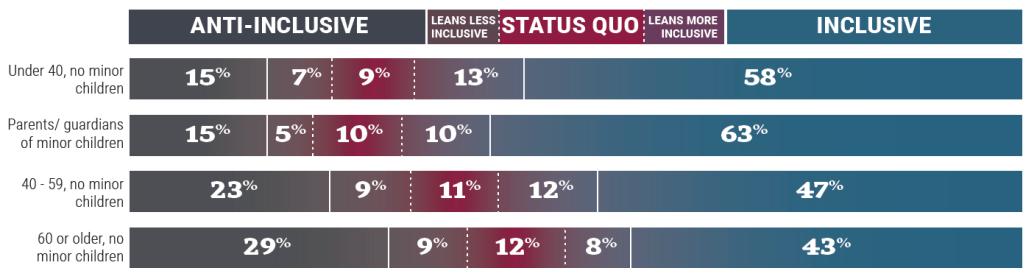
There are definite differences when we examine U.S. adults by age and life stage, but the majority of each segment still falls on the inclusive side of the spectrum.
2025 – U.S. Adults by Age and Life Stage:
So where is the pushback to inclusive content coming from? Well, it is, indeed, political. We can certainly see that when we compare the responses of conservatives and liberals, as there are significant differences. But even then, the majority of conservatives still fall on the side of inclusion.
2025 – U.S. Adults by Political Values:
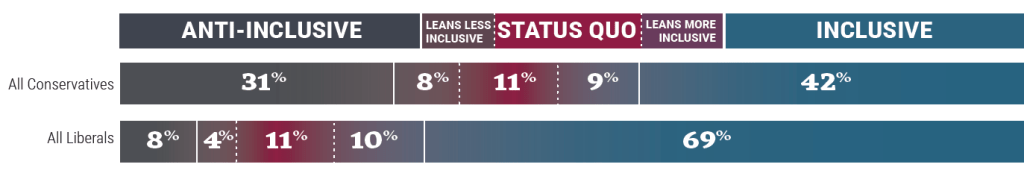
While the larger segment of anti-inclusive conservatives are likely driving anti-inclusive rhetoric and initiatives politically, it bears remembering that they don’t represent the majority of Americans, and they don’t even represent the majority of conservatives.
Most Americans, regardless of political values, support inclusive content in museums. Period.
Navigating inclusion during the immediate future has, undoubtedly, become more fraught. We don’t want to dismiss those challenges.
But neither do we want to dismiss the fact that inclusion helps all of us understand the many perspectives and life experiences of the world, helps us understand the world and its history more completely, and is what most people want from us.
In fact, the data indicates that the biggest risk we face is losing our credibility with the public by not telling the truth…and for most people, that requires us to be inclusive of all humanity. We’ll be sharing more of their thoughts in a future Data Story.
Until then, existing tools can help you navigate this period of uncertainty, including Audiences and Inclusion: A Primer for Cultivating More Inclusive Attitudes Among the Public and our Data Story “Beware! The False Consensus Effect.”
Annual Survey of Museum-Goers Data Stories are created by Wilkening Consulting on behalf of the American Alliance of Museums. Sources include:
- 2025 Annual Survey of Museum-Goers, n = 98,904; 202 museums participating
- 2025 Broader Population Sampling, n = 2,079
- 2017 – 2024 Annual Surveys of Museum-Goers
- US demographic data from the U.S. Census Bureau
*Data Stories share research about both frequent museum-goers (typically visit multiple museums each year) and the broader population (including casual, sporadic, and non-visitors to museums). See the Purpose and Methodology (Update) Data Story from September 11, 2025 for more information on methodology.
More Data Stories can be found at https://wilkeningconsulting.com/data-stories/.
© 2025 Wilkening Consulting, LLC

Upcoming Events
-
What It’s Like to Participate in Museums Advocacy Day
Event Date:Presented by: American Alliance of Museums -
From Idea to Acceptance: How to Submit a Winning Annual Meeting Session Proposal
Event Date:Presented by: American Alliance of Museums -
-
Climate Change Education Virtual Summit
Event Date:Presented by: American Public Gardens Association & the United States Botanic Garden