Transcript
Susie Wilkening:
Good afternoon or good morning, depending where you are everyone, and welcome to this webinar. We’re going to give everyone just a few more moments to join the webinar room. And then we’ll get started. And great. I see some people are already starting with the chat. If you want add your name and where you’re coming from and what museum you’re at, that would be wonderful because that gives us an idea of who is here with us today. Oh, Museum of Flight. That’s just down the road from where I am. And we’ve got some I see some museums are already participants of the annual survey, and I see some museums that are not. That’s wonderful to see. Okay.
So I’m gonna go ahead and get started.
I wanna welcome everyone to this webinar on data versus sustaining hope in uncertain times. We are so happy to see all of you joining us today. And if you’re just joining, we’re putting our names and where we’re from in the chat. That’s a really great thing to see. Let’s talk about what’s going on in The United States and also globally. Some national trends as well as some local ones and some of those global trends too.
So, are you feeling a bit uncertain of things? 2025 has certainly been a time of upheaval. As we all experience shifts large and small in our daily lives with our audiences, in our communities, in our country, and around the world.
We continue to see how different values, attitudes, and beliefs are affecting how all of us live in our communities. As well as the capacity of museums to engage visitors effectively with content. Against this, we are also being fed a national narrative that we are a nation divided.
Without shared human values impeding American against American. Things are so complicated. For ten years, the annual survey museum goers has been focusing on helping individual museums think about their audiences more completely. Including those sometimes wildly different values and life experiences. As well as the things we hold in common.
Because of this work, museums that participate in the annual survey tend to be better prepared to deal with this incredibly complicated landscape of challenges. Increasing their effectiveness while also more nimbly dealing with potential landmines. Today, understanding your community, whether it’s your local geographic community, or community of interest or perhaps both, is more important than ever as we face political headwinds. And there are greater threats to inclusion, climate action, and more.
We’re not gonna make that sense of uncertainty go away. We’re gonna talk about how the annual survey can help you move forward more confidently and effectively. So in this session, I’m gonna share a few things.
First, I’m gonna share some of our 2025 findings. Which indicate that we all have a lot more in common than that national narrative of division suggests. I’m gonna give you an overview of what the annual survey museum goers actually is. Just enough methodology so you know how it works.
We’re gonna explore what reporting looks like for a museum that participates in the annual survey, and we’re gonna discuss the themes for 2026 and how they were designed to help us navigate economic uncertainty in particular. And we’ll share how your museum can participate.
My wonderful colleague, Jessica Strieby, is behind the scenes on this webinar, I’ll be active in the q and a addressing quick questions as we go. So if you have a question, go ahead and put it in that q and a, and then I’ll be addressing their questions throughout as well. But before we really get started sharing some of the data from 2025, we have two quick polls that we want to do. And so, Cecilia, if you could get that up, that would be fantastic.
So our first one is, what is your experience with the annual survey of museum goers? And you might have to scroll to see all the answer choices, by the way.
And, Cecelia, I’m gonna trust you to close it because I can’t see the results and how they’re coming in.
Okay. So looks like most of you have know very little about it.
Or have never heard of it until recently, and then we have some of you have purchased paid in the past, and a few of you have already signed up for 2026, which is great.
Okay. If you can load up the second poll and, again, you’re gonna have to scroll to get to all four of the answer choices, it looks like. Here we would like to know how much data you have on your museum’s audiences or community.
I’ll give it about ten more seconds. Oh, great.
I love to see that a lot of you are doing something. Some of you are doing quite a bit. That’s awesome to see as well. Okay. Great.
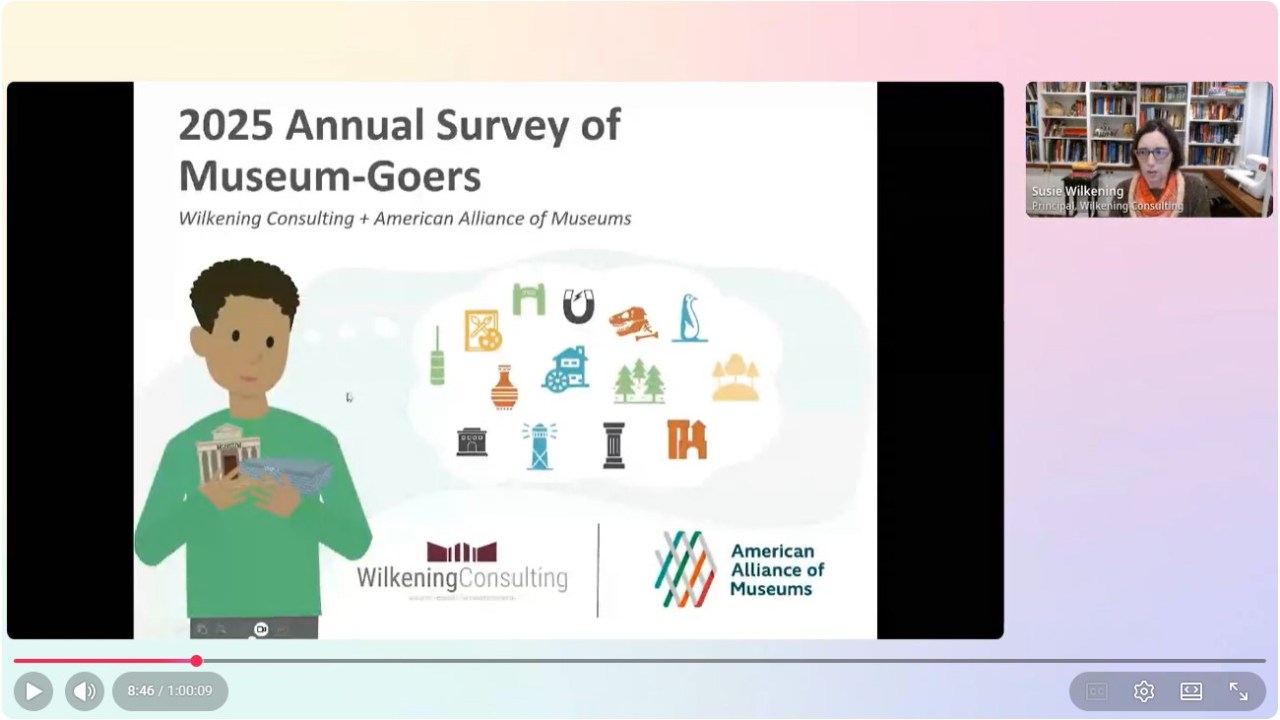
So the first thing we want to do is share with you some of the results from the 2025 survey. So and they are actually some of our more hopeful results. In fact, a lot of the results in 2025 were rather hopeful. So let me just pull that up on my screen for y’all.
And we’re gonna do okay. So is gonna be just a tiny bit of methodology so you know who we’re talking about first. So we talk about the annual survey of museum goers.
We’re actually talking about two different surveys. We wanna capture responses from visitors of all different frequencies. Most often what we’re talking about are what we call frequent museum goers. And these are individuals who are responding to a request to take a survey from a museum communication list. And we’ll talk about that more when we talk about how the annual survey actually works. But we’re calling them frequent visitors because they’re on that communications list. They’re having that that regular communications from at least one museum and having that regular involvement.
So those are the frequent museum covers.
But we also wanna hear from more casual visitors to museums, sporadic visitors to museums, and non visitors. Casual visitors may people who go to a museum maybe once or twice a year. So sporadic maybe every year or two, maybe every three years. And then non visitors are people who are like, I never go to museums. To do that, we field a demographically representative sample of US adults. And so we have those two different surveys going out into the field at the same time.
In 2025, with those frequent museum goers, we had over 200 museums field the annual survey of museum goers, and we had nearly 99,000 respondents. And you can see they’re coming from a variety of different museum types Though there are a lot of art and history museums out there, so that’s where we get a lot of respondents. But we see we have, stable samples from other museum types as well. I mean, that’s something that’s really for us to be thinking about as well. But this is a survey of this frequent museum goers coming mostly from email lists, social media, and just whatever communications methods those museums have.
The broader population sample is a sample of just over 2,000 US adults, demographically representative. And we filled that sample usually around the January. And I just wanna make sure y’all think about what happens in the January of 2020, five.
Was the inauguration of Donald Trump. So it was actually kind of right at that moment in a way, a very clean moment in terms of ending one administration and beginning of a new administration. And that’s actually really important for the data that we’re gonna share.
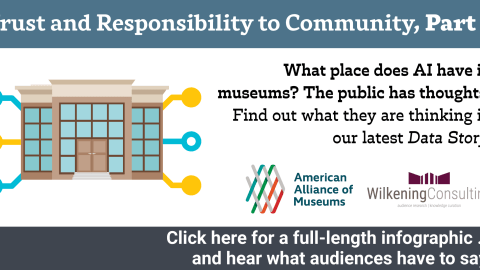
But one of the themes that we talked about and focused on in the 2025 annual survey was trust and responsibility to community. Now when we were writing the survey, it was actually in the fall of twenty four.
And we did not know who was going to win the election.
So we were thinking about, okay, no matter who wins the election, we’re gonna go into a period of chaos and uncertainty.
So we’re seeing what that means in a Trump two point o administration. But there would have been also a degree of chaos and uncertainty with the Harris win, simply because Donald Trump would have said the election was stolen, and there would have been repercussions coming out of that.
So to some degree, chaos and uncertainty, there would have been a segment of the population is going to be very unhappy.
That would also lead to chaos and uncertainty to some degree. So knowing that and knowing how human nature tends to work, when things are chaotic and uncertain, especially on a national level, people tend to catastrophize the abstract in that national level.
So but they tend to look to their local community for certainty and stability. And we wanted to think about that and how we can root our work in that local community sense of need for stability as we move forward into a chaotic uncertain period. And that formed our thinking as we went into this first question. So let’s look at the question because there there’s some really important things we did with language on these questions.
Which of the following do you think most people in your community would agree are important? We’re gonna talk about the question first, then we’re gonna talk about the data and how we’re presenting the data. After that.
So with this question, you can see we had italicized I don’t know if you can see my little pointer here, but most people in your community which of the following do you think most people in your community? We want people to think about the people they see every single day who they rub up shoulders against when they’re going to the grocery store or walking down the street, whatever. Make it very real and concrete, not this abstract whomever is out there. If we had said, what do you think most people agree on? We would’ve gotten nobody gonna agree on anything. We focused it on the community. So that was the first thing we did.
The second thing we did is we thought about that word values. This is a question about values. The word values, kind of a loaded word now. So we thought if we put that word there, that might make this question not work as well. So we actually dropped the noun. Can be an effective tool when you’re thinking about language.
So we said, which are the following we didn’t say which are the following values. We just said, which are the following?
And now what was our measure of success in terms of did we make a question that people were able to then go and answer? We were looking to see what percentage of respondents said none of these. Because we had a large number of people saying none of these would be like oh, this question didn’t really work. And if you look at the far right of the screen, what you see is only 3% of respondents said none of these.
So we’re like, yes. This question worked. So that was our first thing. Now what was this question actually then supposed to do for you thinking about what your work in museums?
When we looked at what we’re trying to figure out with this question is we wanted to give y’all the opportunity to think about how do you root your work and shared values? What are the things that we do agree on in our communities and in our country?
What do we agree on as human beings?
So one of the things that we’re looking at is we’re saying, we agree that these are important things. We’re not agreeing how they’re important, just that they are important. So we can then say, yes. We know this is important to our community, it’s important to us. And this is how we’re gonna be addressing this thing in our museum.
So let’s look at how the representing the data. This is kind of a dense slide because we have a lot of things we’re going on here. When we look at these this data chart, what we’re looking at is the red bars which is all almost 99,000 frequent museum goers. Primarily from The United States, but we do have international respondents. We have a couple of international museums that also participate.
Then what we do, just to kind of give you some nuance, as we break down those respondents, those 99,000 respondents by life stages. You can kinda see how these different life stages play out and how people And then the gray bar is going to be that demographically representative sample of US adults, so you have that comparison. What ends up being important? What do we all kind of agree are important? Well, for museum goers, number one answer was the value of learning and education followed by the importance of family, showing kindness.
Those are pretty wonderful things.
For US adults, number one was the importance of family, followed by showing kindness. That gives you some information that you can then go, okay. We know family is important to most people. Well, of course, we need that, but now we have the data.
And so you can then say, if you’re doing an exhibition about family, let’s say, some way about family, who knows, whatever you’re doing, you can say, we know that family is important to people in our community. It’s important to us at our museum as well. That’s why we are doing this initiative or this exhibition or this program about whatever you’re doing. Because family is important to our visitors, family is to us, and family is important to our community. It’s just kinda making this value sandwich where people are then going nodding their head and going, yes.
Yes. That is important to people in our community. Yes. It’s important to me. And now I understand why you’re doing what you’re doing. This makes a lot more sense. And then we’re likely to go, okay. And go along with what you’re doing and follow that logic. It also kind of tamps down emotional responses if they disagree. And that’s something that’s really important as well. Because they may still disagree with why we’re doing but it gives them more of an opportunity to have a rational conversation with you about their disagreement instead of an emotional confrontation.
And you can work with a rational conversation a lot more effectively than an emotional confrontation. So just get makes the conversation a lot easier to have. So thinking about how do you route your work in these shared values of what these things are important, can be really helpful as you’re moving forward on your programming and your exhibitions in the coming years. And we will be releasing this data and the data story coming up.
I promise. Okay. Oh, I went too far.
The second question we asked is also the wording of this question was really important. Because we had found over the past few years and whenever we ask questions about community, a museum’s serving community, engaging community, or broadening our reach community, or outreach to community, there’s some very key words that are used there around community. We’re gonna come back to that. We kept getting about 15 to 20% of respondents saying, none of these. Not your job.
Stay in your lane, not appropriate. This is you know, too woke to do. This is not your, you know, That kind of pushback, primarily coming from less inclusive individuals. Who said this is just not your mission.
And this was always something we kept scratching our heads over. So we kept asking these questions in different ways and kept getting this response. And so we tried again this year. We want to see. Let’s try this question in a completely different way.
There was a some responses that we got last year that really helped us think through this question in a new way. And that was when we saw some responses that said, we think that museums are using the word community as coded language for would say things like wokism or inclusivity, something like that.
And that’s when some bells are going off in our head. We’re like, oh, oh, oh, oh, because when we talk about community and museums, let’s think of those words that we tend to put around the word community.
Broadening, engagement, outreach, the words I just said a few moments ago. Those are words that often come out of social activism.
Which tends to come from more liberal, inclusive organizations. I’m not saying that’s bad. Those are actually really great things. But we can understand the logic then of less inclusive individuals saying, we’re having a problem with this.
Understanding their logic can be really helpful to have more effective communications with them, and more effective outreach to the broader community as well.
They’re part of that community. So we wanted to think about this community question again. And we said, okay. We don’t wanna lose the word community. We don’t wanna lose our answer choices. We wanna think about how do we reframe the question in a way that maybe doesn’t present that response, that visceral response people have, some people have.
And then effect make it the question more effective for a broader audience. And so what we ended up doing is looking at some previous research we had done on the for the upcoming America two fifty commemoration and looking at American values. And looking at how most American values are perceived, American values are perceived through this lens of liberal values versus conservative values. And we looked at the list of with the word community to make this question read nonpartisan.
So people then answer the question. And that’s where we hit on the word responsibility. Now the word responsibility is not word that liberals dislike. Liberals do appreciate the word responsibility. But it’s not a word that liberals use as much. Conservatives on the other hand use that word quite a bit.
So we put that word responsibility. What are the responsibilities of museums to community? Made that question, and our measure of success, does this word read new does this question read neutrally and by in a bipartisan way, percentage of people said none of these? Scarcely anyone.
So for us, that was like, yes. This question was effective. It worked. People answer. The question, which is a big win. So it’s not the word community that was necessarily the issue for some respondents. It was the words we’re putting around the word community. So thinking about language again and how we talk about community more effectively with an entire community.
Is really good. Now looking at the answer choices, kept those pretty much the same, and you can see what people were saying, preservation of community history, objects, and stories, the things that really set museums apart from other organizations in our community, that’s where people answered more than anything else. Educating children in the community was also a very big one. You can kinda see how that broke down.
And, again, we’ll be sharing this, research and data stories coming up.
And then the last question that we had here was around in this time disinformation AI and partisanship, what do you want to see museums do to help you feel information presented as credible and trustworthy? This is a question that, pretty much across that political spectrum, people have emotional responses to these words. Especially disinformation and partisanship, who can put AI in the middle.
People have different responses to that. But we flipped the question really quickly to a proactive question and with proactive responses so we can just kinda see what the people want us to do.
They’re really wanting to see those original objects, those sources of information, those original archival documents, putting a lot of faith in those original objects, looking at them less critically than perhaps we do in the field.
But understand that the public looks at them less critically. And then demonstrating and encourage curiosity to consider all evidence fairly was the second most popular answer choice. This is another place we thought about language balancing. Curiosity is something that’s tends to skew a little bit more liberal. We know that from our previous research. So we partnered it with that word fairly which is a word that, conservatives are more likely to use than liberals to kind of balance out that answer choice and ends up being the second most popular one.
So that gives you a sense of what we’re kinda seeing with these answers and these and these questions. But there was more that was really interesting that we saw in the data, which was really actually a response to the first eight weeks.
Ten weeks of the Trump administration and what that they those changes in terms of how they thought of museums.
So let’s look at some of those shifts.
Now thinking back to that broader population sampling, we had asked some trust questions back in 2021 for the broader population. With a study we did with AAM. We had some data from then.
When we actually go into the field for broader population sampling, we go into the field twice. One is that initial sample in January, but then individual museums sometimes ask for a regional sample or a local sample. For their broader population. And this year, we ended up with 22 states and metro areas that we had samples of for on behalf of individual museums. We don’t feel that research until late March. And we end up with a sample of over 7,500 scattered around the country still. And still demographically representative and politically representative. Of the country as well. And so we end up with these two samples over a change of about eight weeks.
This is what was so very interesting is that there were shifts in how people perceive things over that eight week period as things started becoming more chaotic and uncertain nationally. One was a quick shift that we saw in the of public libraries. The shifting towards libraries being perceived as nonpartisan and neutral. And you can see that shift here from the gray bar, which is January, to that blue bar, which is March.
Here, that question we already saw, that shared values question, we’re really looking at here though is the shift from January to March. As things became more chaotic nationally, people were like, but here at my community, we still have these shared values. We still have this sense of stability. Things are still pretty normal as they were before in my community. And so people are looking to that local community for that sense of stability and more likely have these answer choices. But these were really remarkable significant shifts over an eight week period that we’ve never seen before in broader population sampling over that change shifting time period.
When we look at the responsibility of museums community, again, we seek across the board shifts. Or what they’re saying, okay. Or saying museums actually have more responsibility to our communities as we’re going into this more uncertain time period where we have across the board higher responses, especially around the two most popular answer choices, preservation of community history, objects and stories, and educating the community. Kind of a doubling down on the things that they perceive us doing best and are most responsible for in our community. And then those things that they want us to do to be perceived as credible and trustworthy, especially in this period, again, significant shifts, but especially looking at higher rates, same showing those original objects, the sources information, things like that.
There’s also a battery of questions that were, did not go into that museum goer survey. Scale from zero to 10, what’s how trustworthy do you find these different things? It’s almost impossible to read this graph, so we’re gonna break it down for you. For those 10 things that we were asked we actually have data from 2021, so you kind of have that benchmark there. But we’re looking at the blue and the dark gray again. So the dark gray is January, the blue is March.
Three things didn’t really shut at all in terms of the perceptions of trustworthiness. For nonprofits local news, national news. Interesting to kinda feel that again right now, but maybe in maybe this January. But during that eight week period, we saw significant decreases on three things. Corporations and businesses and social media, but especially the US government. We saw a huge drop of seven tenths of a point during that time period, which is just unheard of during the eight week period. It was a bipartisan drop.
It does matter scale. Liberals dropped a lot more than conservatives did, but conservatives did drop as well. But on the other hand, things some things increased. This is where things get interesting for museums. Because it wasn’t so much that people were, like, losing trust. It was more like, what do we trust in this time period as well?
What are those places of stability and credibility? And those friends and family, public libraries, and museums. And you can see there’s also a little increase for researchers and scientists. What was really interesting is that we fielded these this set of 10 questions again in May with another sample.
And the numbers for public libraries and museums held in May but went into more significant territory for researchers and scientists. Which is really kind of very, very interesting to see.
There was another thing that we saw shifting during this time period as well. So as we saw this kind of good news and hopeful news coming from the broader population, in terms of trust for museums, we were seeing that something else in the muse frequent museum goer survey, which is around written and comments. There was an open ended question in that survey that asked, actually, we have the question here, this question about thinking about, you know, the coming months and years, especially that this last bit. What concerns do you have about museum trust and credibility in the coming months and years? You can see it’s kind of a big question. It’s the very last question of the survey. So This is the last bit right here is what people tended to focus on when they answer this question.
So some of the museums in the annual survey launched their surveys in January, and their response respondents said things like this, which is what we kind of expected to see when we wrote the question. You can see these responses are pretty I would actually call them innocuous. I mean, they’re like, oh, okay. Yeah. We understand where they’re coming from. And they’re pretty succinct. They’re pretty short.
When we pull down all the open ended responses, we have about I don’t know, 50 or 60 thousands of these. That’s a lot of them. They come to us in a spreadsheet and they’re chronological, and we flip to the bottom of the spreadsheet, we pull this down in April. Looked at the April responses.
Can you’ll see they were totally different. Suddenly they got a lot longer. And the word choices that we’re using were very different. They were much more emotive, much more emotional, heavier words. And when we parse this comment, we’re not gonna read it all. You can read it. But if you parse it, you can see some of these heavier words. So you see words like elimination, you see words like oppressive. Those are really heavy words be using, and it’s open in a comment and a survey. One of the things as you go through some of these comments, we have several to share with you. The avatars that we use, with the comments are generally representative of the demographic characteristics of the person who said them. So you have a sense of who’s saying these things. But you can see already in April, they are coming up with exactly the kinds of things, excuse me, The pressures that we continue to see over the summer into the fall coming from, government administrations, both, federal and some states. And also exactly what the those federal and some state administrations were saying in terms of museums and the pressures and concerns.
On the next one, the first part is exactly what we kind of expected to see. It’s the second part. So again, we’re seeing some heavy words hostile. Threaten the freedom of curatorial choices. We see a lot about freedom of curatorial choices, academic freedom, curatorial freedom. We see that phrase quite a bit. Tragic, another really heavy word there for every visitor to the museum. Thinking about the visitor too. Museums are the most trustworthy place in America, right now.
Fearful, another heavy word, people will get reject all truth. And here’s where we have another thing going on. Fearful of museum staff being harassed for doing their jobs. So these comments there’s two signs of fear that they’re seeing. They’re seeing fear of the for the museums and the content that’s being shared. And that the content being shared is going to be corrupted in some way by these influences. So it’s that kind of fear. But the second kind of fear is fear for you. And fear for your ability to do your job safely and that’s physical safety as well as mental and psychological safety.
They want you to be able to do what you do best, and they have confidence in you doing what you do and what you do best. And they’re articulating it, and they’re articulating it regularly. And they were already doing that in April. Here’s another one. Without meaning to be dramatic, please, please, please protect museums as inclusive places of equity, inclusion, and fact based information for our society. I’m so afraid to lose all of this.
The federal administration will want its version of history, which is close to 1925, then 2025, and funding will be dependent upon the museum’s willingness to acquiesce. And here, we have some I think some a very deliberate usage of the phrase revisionist history. If you’re a history museum, you’re gonna be listening to that phrase very carefully because we know that word that phrase has been weaponized quite a bit in terms of how history has been, discussed.
By less inclusive people in particular over the past fifteen, twenty years. But now the phrase is getting flipped, and saying that this more restrictive history, this more edited history is revisionist history, and we’re not getting the full stories. We’re that I think that’s a very deliberate use of the phrase there by this respondent. So there’s a lot of concerns.
So thinking through what we’re seeing in the data, and we have another client project right now that, we’ve just finishing up a project with that’s out history museum that was looking at first amendment freedoms and how we talk about those in museums. One of the things that we’re really seeing overall is that there’s a lot of trust in the public and museums.
They have lots of good reasons to trust museums, and there are lots of concerns about museums for good reason. And lots of concerns for you and their ability to do your jobs right now. But they do feel that you have places that are trusted. And that your community assets and that you are really very vital to your community so and places of stability in the community as things are so uncertain.
They do feel that there are many things that we all agree on, and that these can form that solid foundation for museum work that’s effective truthful, and shares experiences of all community members and they’re trusting you to continue to do that?
And that we have these responsibilities to communities. Preservation of collections is key. And so is education, artistic expression, and telling the truth. And It also indicates that this articulation that is unique assets and positions that we hold in the community is really important. Especially in this moment in time. They’re counting us to share those wonderful things that we have in our collections, to tell the truth, and also to encourage visitors to consider evidence fairly. And with an open mind.
As things probably will continue to feel uncertain and maybe even more so, there does seem to be a looking at the data, increasing faith in museums as trustworthy and vital institutions that the public cares about. Because we matter to them and that’s something to really kinda keep in mind as we face these political headwinds. So I wanted to share these results in detail with you to illustrate how we can leverage the annual survey to help think through and navigate uncertain times. But it wasn’t the only theme of the annual survey that we focused on this past year. In fact, we asked a lot of other things.
In addition to our standard benchmarked demographic questions, which you’re gonna learn about more in a couple minutes, we also check-in every year on visitor attitudes towards inclusive content and museum. So let me see if I can change my screen share here so I can show you do this again. Screen share again. There we go. That should be working. Hopefully, it doesn’t look all gray for y’all. But where you can find the data story, some this coming this year.
If you go to the Welcome and Consulting website, you can click on data stories right at the top. You can find all of the data stories from this year. Right now, we’ve been releasing some data stories on social experiences, which are really lovely and heartwarming to read. We all know we are pretty great at social experiences, but let’s hear the public talk about that too. And talk about what’s getting in the way of social experiences as well.
So, we’re release I think we are releasing one today. Maybe I think another one came out today. And then if you scroll down, you can also find our update to inclusive content. In uncertain times. This is also a really wonderful one to read. Because it does show that the majority of people, including in a bipartisan way, the majority of Liberals moderates, and conservatives want inclusive content in museums.
That’s a fabulous one to go read whenever you’re feeling a little pressured on inclusive content to remember that the majority of people do support that work as well. So you can go look for those things, and you can also search for all kinds of different content there too. We have about a 100 of these, I think, now on the web site. So there’s a huge amount of data there that you can, go find.
Okay. Jessica, are there any big questions from what I just shared that I need to address right now, or should I go ahead and switch to how the annual survey works? I see. There’s one about fundraising trends.
I don’t have data on fundraising trends yet. I can see understand someone working would want to. Know that. I think that the current data can be leveraged into that pretty well and effectively. But one of the themes for this upcoming year is adjacent, and that is about earned income. At museums. And we are asking some questions about membership, which might be helpful. As we think through some of this and might look for the correlations there. Because the tricky thing about fundraising trends is that most respondents to the annual survey are not donors. To museums. And so that’s where it’s you know, we’re not able we’re not able to get really good critical mass there with the donors. That’s just a harder thing, harder nut to crack. So to speak. Okay.
There’s also one question at the chat. Okay. Let me look at the question. Down there. Is the option to break out fine? Yes. We do have findings for different types of museums. I will actually tell you how many different types of museums we have for this, this past year in just a second. So, yes, hold on to that question for just a Now let me switch here to there.
So let’s talk about the annual survey and how it actually works. So we’re gonna do a little methodology. I’m gonna keep it just light enough that you can know what’s going on without going into too much detail. But we do field the annual survey.
Annually, in partnership with the American Alliance of Museums. And what we’re trying to do is learn more about what obviously, as you saw, the museum audiences as well as the broader population wants to thinks about museums, both individual museums, how is your museum doing, But also, how are all museums doing?
So let’s think about how we actually put together a survey.
When we think about survey and we think about the questions that we’re asking, there’s three kinds of questions that we tend to think about. One is what we call identifying questions. That’s trying to understand who our audience is, and that’s where we’re looking at their attitudes, their values, their motivations, and their demographic characteristics.
Who are these people? What do they like? What do they what drives them? All those things. Sometimes we’re asking questions that we consider advisory. That’s what they want from a museum.
And these are the types of questions that when you get the data back, you’re probably going to adapt and change in response to those questions. It’s about how you’re meeting their needs, or how you might be falling short. So classic advisory question, this is not one we put in the annual survey, would be how clean are our restrooms? And some data came back to you, your restrooms are really dirty. What are you gonna do? You’re gonna go clean the restrooms. It’s an advisory question. You’re merely gonna go something about that. Right?
The third kind of question that we ask what we call a lay of the land question. Lay of the land questions help us understand how different people, with all their different values may respond to content that you are sharing with them, especially content that may challenge them, or that we as a society don’t have consensus on.
So our questions about inclusive content. Or maybe if we did some questions about climate change? Those would be lay of the land questions. We don’t consider them advisory, because if we got a sample back that said, climate change is a hoax and you should not be doing anything to adapt climate change, we’re not gonna do that.
But it would help us understand that audience is gonna need something really different than an audience that says, oh my gosh. This is real, and we need to be, like, going full steam ahead on adopting and changing and evaluating what we’re doing to be more climate sensitive. So that helps us really think about how are we gonna be most effective based on who our audience is and where they are.
So as we mentioned earlier, we field the survey in two different ways. One goes to those frequent museum goers, and that’s where museums sign up to participate there is a modest fee attached to it. It’s $1,350 a year. But if you do early bird, it’s $12.50. We survey your communications lists. We gather your data.
It all gets aggregated together, so we have this big sample. Then you end up getting your results back. We’ll talk about that in a minute. But we have this this big sample of frequent museum guards that we can then learn about. And in 2025, we already talked about how many people responded, how many different museums participated, but and here we go to those peer groups. We end up with detailed peer groups comparisons across 45 different museum types. Did you know there are 45 different museum types? When we ended up cutting it, that’s how many we ended up with. And 29 geographic areas. We need five museums or more. And a peer group, or geographic area to run a data cut.
So if you have five museums in a metro area, we will run a data cut for that geographic area. So Seattle usually gets a data cut. Because there’s usually five museums in Seattle that run the annual survey. And so then we end up with Seattle data. And so that museums in Seattle would get Seattle data, and that there were for that reason. And the same thing with all these, peer groups. So we usually have five presidential museums, so they get presidential data. Or five air and space museums, if we have five air and space museums. You get the idea.
So those all automatically end up whoever relevant ones end up in the reports. And then there’s that broader population sample. So the end up the survey, how it’s structured, is the first questions are about benchmark questions about your museum. It’s about their attitudes towards it. It’s about their motivations around it. And the demographic questions. And then we have our themes here every year.
So those benchmark questions, these are the first seven questions of the survey. And that’s where we’re looking at repeat visitation rates, the motivations, what you do well, what you can improve, how far they live from you, repeat visitation. And we do the same questions every year so we can track results over time. So we have some museums that this year will have ten years’ worth of data. Which is amazing. We track it for them. They have these charts. It’s a great we have some museums, it’s our first year, and we’re gonna start benchmarking for them. But we do make sure that we keep these questions pretty much the same and then we can track it over time. So it’s very much, you know, about your museum.
Now for and the same thing with the demographic data, we track that over time as well. But for the research themes, those change every year. It’s the middle part of the survey. And the themes are based on chosen based on input the previous year’s annual survey participants. So what I we heard from twenty five participants fed into our thinking for 2026. Trends and shifts impacting the museum field, questions arising from previous research, and then bigger, broader societal trends and events.
So themes for this year, we’re looking specifically earned income and visitor impact on around that. We’re thinking about economic uncertainty. We’re thinking a lot about how economic spending right now 10% of households are drowning, like, half of consumer spending. That’s gonna impact museums and earned income for sure.
We’re also thinking about the meaning and value of museum experiences. I think, senses of awe and wonder and respite and all those different things. And how people do have these experiences in museums that are, life affirming in many ways. So we’re looking for those positive kinds of experience. We wanna make sure that this survey is not gonna raise any red flags in certain in some communities. That it’s going to be one that’s going to be a productive survey no matter where you are in the country.
We’re thinking about that a lot.
That said, while the annual survey is going out to frequent museum goers, is going to be is we’re thinking about that. The annual survey participants receive early access to that broader population sampling results. What goes out to the that US sample. We got and we purchased that sample. These comparative results can be really helpful because it helps us understand casual and sporadic museum goers as well as visitors to museums. But that national broader population sample goes out in a way that is pretty anonymous. They don’t know who’s behind it, and there’s no museum’s name attached to it.
So this year, that broader population sample is also likely to see a battery of questions about political pressure pressures on museums, perhaps censorship of museum content, and also some general political polling on government support of museums. Those questions will only be fielded to that broad population sample. They’re not gonna be in that museum goer survey.
That’s critical information we all need to have as we think through these political headwinds that we’re facing right now as a field. So these annual survey participants are going to have early access to that even though their, museum going sample is not gonna be seeing those questions. Let’s just kinda get double extra, research out of it.
Okay. So when you filled your survey, and all the data comes in, that’s when the we get to the analysis phase. And the analysis phase actually starts with reporting to the museums that participate. So the first thing that happens is we create lots of reports, so many reports. Every museum receives a spreadsheet report with all of their results, comparative data against their peer groups, their geographic area, if they have historical data, it’s included. So you can see kind of this is like a little snapshot, just one tab of this particular report. You can see as long as the tabs are across the bottom. And then about a month later, then there’s a graphic slide deck report Here’s just one page of a slide deck report where you’re looking at some of the results some of the slide deck reports get to be pretty long, especially if they have historical data. Especially if they’re feeling broader population data as well in their community. But you can get a sense of what those kind of look like. A few museums also ask us to do a report on their responses where we actually go on and code their qualitative responses. There’s an extra fee for that. But that’s something that’s also available upon Quest.
And then we also analyze both surveys as frequent museum goers the broader population sample, we’re looking at it quantitatively. We’re going through it rigorously, lime almost like line by line, going, what’s going on here with all these crosstabs? We really wanna understand what we’re seeing in that that data. And then we’re also looking at qualitatively. So in the frequent museum goers, we’re really lucky. They pour their hearts out to us, and they’re open in the comments. So and we take a what we call a democrat graphically representative but then have randomly chosen sample about 8,000 of them. And we hand code.
Those responses. And we do that by hand for a few different reasons. First of all, we’ve never found any program, including any AI program, comes close to what our brains do in terms of the nuance of responses. That we get. We get really complicated responses, and it would take us actually more time to train AI to do it than do it ourselves.
And, also, we we found that the public doesn’t want us to put their data through AI. So there’s lots of reasons why we don’t do that. But also, if we were to do that, it would cheat ourselves of the learning opportunity of actually reading those responses because that is what actually makes us really good at what we do. As we read thousands of those responses, and it helps us get into the brains of these different perspectives. And these different world views and understand how they’re thinking in these different ways. And would we have ever picked up on museums are using community as coded language for wokism if we hadn’t actually read the all sorts of responses No. Probably not. And that taking all that time to do that is probably the most important thing that we do. I joke that I have a love hate relationship with coding, It’s true. But it’s the most important thing we do, I think.
And then when we have results, you get to see them come out, and this goes to the entire museum field, because we do this on half of the entire museum field with those data stories. And those come into your inboxes. A lot of you probably got one this morning. Where we share these infographic data stories of the results, and they come out about once every week or two. Through the fall and into the winter. So how do you enroll? Enrollment’s really easy. Sign up takes less than five minutes. We ask that you enroll by 02/28/2026 to get that pricing at $13.50 for participation. But if you enroll by December 1, you get the early bird rate of $12.50.
And then you send it your survey out sometime between January 1 and 03/08/2026. We’re pretty strict about this because we need to be able to create that aggregate sample and create all those peer groups. And we need to be able to get going on reporting. So we’re pretty strict that you have to get that sample out your email list and communications list no later than March 8. You get to see your results come in through a dashboard so you kinda know what’s going on as they come in.
And then in May and June, you start receiving your We have a research portal where you’ll get your download your reports, and then we are starting to archive reports there as well. You get that spreadsheet. You get your slide deck. Sometimes we do a one pager of some data as well. And so you start getting those things coming in in the later part of the spring.
Then over the summer, you have opportunities to talk to us. You can talk to me. You can talk to Jessica. You can talk to Diamond. You can talk to Noel. Depending on what you’re doing and what you’re thinking about in terms of the work that you’re trying to accomplish in your museum. You get to pick who you talk to; we do office hours. If you are not a tier three member of AAM, But if you’re a tier three member of AAM, you could just sign up for a one on one private call with one of us. And so you have opportunities to get to us in person and ask your questions and say, this is what I’m seeing. What do you think about this?
And so the link to enroll is museumgoers.aam-us.org. There’s also a lot of information there on that website, so you can learn more there as well. There are some ways to customize your survey. There’s just lots of ways you can think about it as long as we can also make sure we’re using the overall structure, and we’re good to go that way.
So, any big questions about the annual survey? And the q and a? Doesn’t look like it.
Well, I know if you have questions, if Jessica, if you could put our emails into the chat or the chat or the QM. Yeah. I guess the chat. That would be fantastic. Fantastic. Because it’s a great way of just learning more and gain touch with us about how to you can customize this for your organization. Or have it work for your organization.
Now we are happy to answer your questions as we go forward.
I And, you know, thinking about 2026 as we go into 2026, you know, one of the things that we really wanna be focusing on is what you do so well, helping you do what you do so well. Is that that’s creating those meaningful experiences that speak to what it means to be human on this planet.
While also fielding that broader population sampling to tackle some of those tougher questions.
But I wanna remind you that we’re actually in a position of strength as trusted local institutions. That’s probably exactly why we are political targets to some degree. But if we keep focused on serving our community, our audience as well, and asking them how we they want us to do that work well.
We’ll be able to navigate these uncertain times much more effectively. And we can do that together.
So with that, I don’t see any other last questions. Oh, we’ll be a new participant this year. When do we receive the link to the survey? Okay. That’s a great question. Okay. So in the q and a, I when do you receive the link to the survey if we if we can already send out by January 1? And do we provide intro language for a to send out? Yes. We try to make it as easy as possible. We have developed over the years, graphics. We have sample graphics. So if you want to use our you don’t have to. We have a set of sample graphics that you can put pop into an email blast. We have sample text that you can start with. You can use it as is. You can edit it. That gives you something at least to start with. And then, you know, the survey will be ready by the January. So as soon as you people are back from the holidays and kind of ready to go, we’re gonna be like, go for it.
We tend to say, giving people a few days after the New Year at least to get back into their groove again. And then by all means, you know, you can start, you can launch your survey probably as early as, like, January. I don’t remember what day of the week that is. But, yes, we’ll be ready to go as early in January as you want pretty much. But we’ll try and make it as easy as possible. We always try to make it easy as easy as possible.
Will we receive a recording in today’s session? I believe so. I think this Cecelia did mention to me from AAM that there would be a recording and that people would be have access to the recording after the session. So I’m going to go with yes on that one. There will be a recording.
And if you’re, a 2025 or 2026 participant, there’s actually already a recording of those that first half in the research portal on the Volkney Consulting website. And there’s also a recording of me talking about the inclusion data. As well. So you have early access to those if you’re not if you enroll. Access tomorrow.
Okay. So with that, we are at one hour.
If there’s anything else that y’all have questions about, whether it’s about the annual survey or about the themes, that we did this past year or previous year or the upcoming year, If you have thoughts, by all means, reach out to Jessica or me at both of our email addresses. We’re happy to chat with you about them. Especially as we’re putting the finishing touches on both the frequent museum goers and the broader population surveys. Because those are getting finalized as this week and next week. So we’re, be be delighted to have as many of you of you participate as possible. I hope everybody has a good rest of the week and weekend. And we’re gonna sign off now.
Thank you so much for joining us.
Upcoming Events
-
Outdoor History Walking Tours 101
Event Date:Presented by: American Association for State and Local History (AASLH) -
I’m In Charge of A Museum Store. Now What?
Event Date:Presented by: American Alliance of Museums -
Gettin’ To Know You: The Art of Networking
Event Date:Presented by: American Alliance of Museums -
Environmental Monitoring for Collections of All Sizes
Event Date:Presented by: C2C Care/FAIC