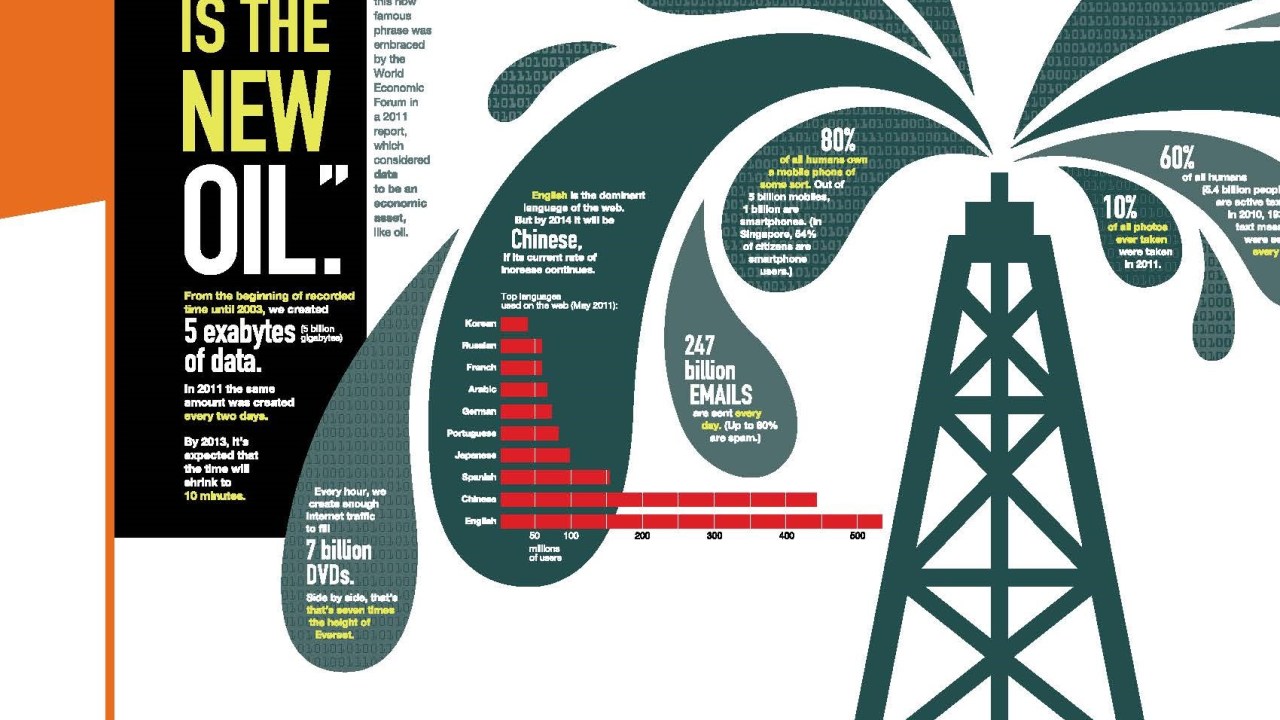
While the human race is rapidly depleting or degrading natural resources—oil, water, minerals, biodiversity—one resource is growing at an exponential pace. Every two days people create as much information as we did from the dawn of civilization up until 2003. Put another way, 90 percent of all the data in the world has been generated in the last two years. This includes digitized versions of traditional print media, as well as all the output of our interactions via social media: tweets, uploaded pictures and video, e-mail, instant messages, etc. Data becomes “big” when its scale is so large it can’t be grasped, managed and manipulated by traditional statistical software, and the scale of the information we are generating now is mindblowing: by 2012, people were creating 2.8 zettabytes of data a year, and this is projected to double by 2015 (“zetta” is 2 to the 70th power). But what’s really impressive are the tools we are developing to make sense of all these bytes.
Sci-fi author Sir Arthur C. Clarke coined three laws of prediction, the third of which is “Any sufficiently advanced technology is indistinguishable from magic.” Big data analytics definitely launches us into that magical realm. While some of the current applications merely increase efficiencies of traditional business (reducing fuel use, for example), they can open up whole new vistas. Predictive marketing enables stores to process the vast amount of personal data they collect on customers to identify what they might buy, and when, with pinpoint accuracy. (Target famously outraged one father by sending coupons for baby products to his teenage daughter, only to have the abashed dad find out “there’s been some activities in my house I haven’t been completely aware of.”) Analysts are becoming ever more savvy at reading the digital footprints we leave via social media, parsing our Facebook posts or mining our tweets to predict our basic personality traits, values and needs.
Big data analytics aren’t confined to marketing, either. Predictive policing modeled on earthquake prediction algorithms is being use to spot “fault lines” of crime, forecasting where and when criminal acts such as burglary and gun violence will occur, and who will become a repeat offender. Esri, which characterizes itself as a “Facebook for Maps,” integrates geographically tagged data with maps, social networks and statistical analysis to help with functions as diverse as finding lost hikers and mobilizing relief aid after natural disasters. Big data is being enlisted by the nonprofit humanitarian sector to do more and better good as well. “Big Data for Development” brings realtime monitoring and prediction to global aid programs: the United Nations Global Pulse project can analyze Twitter messages to predict spikes in unemployment, disease and food supply prices—what they call “digital smoke signals of distress.” At some point, this predictive software begins to look like precognition: a 27-year-old computer prodigy recently created an algorithm that mines news archives to predict possible disasters, geopolitical events and disease outbreaks with 70–90 percent accuracy.
While for-profit companies are at the forefront of exploiting the potential of big data, nonprofit organizations are already creating data sets that draw on museum data, particularly from the arts. Examples include Fractured Atlas’ Archipelago data visualization software, Americans for the Arts’ Arts & Economic Prosperity Calculator and the University of Pennsylvania’s Social Impact of the Arts Project (SIAP). These may only count as “medium large” rather than truly big data, but they point to how such tools may evolve as cultural organizations realize the power of pooled data resources.

While some commentators are already saying Big Data is overhyped, there is no sign of it slowing down. Its growth is fueled in part by the power of combining the information collected via the “Internet of Things” (ubiquitous Internet-connected sensing and monitoring devices) with more “traditional” forms of data collection (the U.S. Census, mobile, landline, in-person intercept surveys, etc.). And it is driven by linking all these sources to rapid advances in computing intelligence that can recognize patterns and learn from its own mistakes. This in turn is supporting a growing workforce of programmers, analysts and data literate managers.
What This Means for Society
For decades, science fiction has speculated on whether human workers may be displaced by robots, whether humanoid or transformer like. Now it seems that the disruption will be more subtle but just as profound. In 2011 IBM Watson caught our attention by beating human champions Ken Jennings and Brad Rutter at Jeopardy. That was just prologue to the real work of this artificial intelligence system. Watson’s ability to understand questions posed in natural language, mine huge data sets and learn from interacting with that data is now being harnessed to create a health-care Watson to improve diagnosis and treatment decisions, and a Wall Street Watson to give advice on investment choices, trading patterns and risk management. The question is not so much whether big data channeled through programs such as Watson will displace jobs, but how it will change the human role in decision making. Researchers point out that the biggest challenge facing doctors, investment analysts, engineers, policy makers and managers is learning to trust analytic algorithms rather than their own judgment.
As our country faces an epidemic of obesity and attendant diseases, and as Boomers enter their retirement years projected to live longer and be sicker than any previous generation, we face a crisis in personal health management. Big data has something to contribute in this arena as well: the Quantified Self movement, consisting of people who believe that collecting obsessively detailed data about their own bodies can improve health and behavior. This movement is driven by increasingly affordable wearable biomonitors in the form of wristbands or sensors embedded in your shoes or sewn into your clothing that track how many steps you take, how much and how well you sleep, your heart rate and how many calories you consume. In the near future, these may be joined by biomonitoring implants tracking your body from the inside. These tools have been shown to affect physical health, and paired with interactive software and a diagnostic, cognitive system like Watson, such monitors could largely supplant traditional psychotherapy as well.

PredPol.
Just as we begin to discover how much we can do with massive data mining, society is already struggling to decide how data should be used. As with all technology, analytic tools themselves are neutral, and the devil is in the application. When does predictive policing become cyber-profiling, the digital version of stop-and-frisk? Will “data profiling” result in a segregated Web, where what you see on the Web depends on your age, race, gender or income? When do an individual’s rights to control personal data trump the public interest in the good that can be achieved by pooling this data?
What This Means for Museums
Data analytics give museums tools that enable them to hone their business practices and become more efficient in operations like food service, sales, pricing, marketing campaigns, retail, development and exhibit design.
Museums can index attendance data to literacy rates, household incomes, average number of children and other community services to yield an intimately detailed picture of whom they are serving. Data mining can help museums understand how weather patterns affect attendance, or create personalized promotions, experiences and discounts based on demographics and past behavior. It has the ability to transcend “traditional” market research information (age, household income, etc.) to create and target demographic and psychographic profiles, delve deeper into understanding human behaviors and reach desired audiences.
Even though many powerful data sets (U.S. Census data, for example) are freely available in the public domain, harnessing the power of big data can still be relatively expensive. Will the competitive advantage conferred by data analytics widen the gap between museums that afford such services and those that cannot? Jacob Harold, CEO of the nonprofit financial watchdog GuideStar, is encouraging nonprofits to master “medium data” about who they are and what they are trying to do as a manageable first step before tackling the “big stuff.” And less expensive ways to learn from data are emerging all the time. Still, to minimize the potential for such inequity, the field needs to compile and share resources that can make analytics affordable even for small museums.
The potential to cross-index museum attendance and engagement data with records about health, educational attainment, employment, satisfaction and life condition means that museums may finally be able to document their real, long-term impact. Prior to this, tracking the life-long effects of cultural engagement with museums has required the kind of massive longitudinal study that is rare in medicine and unknown in the humanities. As MuseumGeek Suse Cairns blogged last year, “What happens when we start judging success as being about lifetime engagement rather than just numbers in the door? The scale and possible granularity of that measurement is staggering.” Philanthropic foundations are already turning data analytics inward to examine the effects of their own giving—see, for example, the Hewlett Foundation’s free, Creative Commons licensed tool for analyzing grants data. This will only increase the pressure on organizations they fund to provide data on outcomes to feed back into that analysis.
Sadly there are countless entities collecting “bad data” informed by poorly designed surveys. Improperly applied, or applied to bad data, analytics may only yield bigger, badder decisions. To wade into the world of data analytics, nonprofit organizations will have to become informed data consumers, even if they don’t have a statistician on staff.

with MIT SENSEable City Lab for the Cultural Olympiad programme and London 2012 Festival.
Museums Might Want to…
Assess the analytic potential of the data sets we are making freely accessible over the Web. What can museums do with digital data that we can’t do with the objects the data represents? What value can be created using large-scale analytics, and how do we encourage researchers to ask interesting and appropriate questions that can be answered with our data sets? We are just beginning to explore the value of big data in the humanities. If museums don’t start data mining to extract the value of their own resources, other more tech-savvy organizations will.
Join the growing number of organizations that are cooperatively pooling large data sets, allowing cross mining—a form of sharing sometimes called “data philanthropy.” Esri, for example, has launched ArcGIS, a “social networking hub for geographic information” that enables any user to share maps in a cloud environment. Many are calling for a “data commons” where even commercial companies would contribute data stripped of personal information. Museums would do well to identify who holds the data they would most like to access for their own analytics, and play nice about sharing their own data, too.
Audit their approach to collecting and using data, and focus on doing data-centric work, becoming what are sometimes called “learning organizations” Museums can seek capacity-building grants from funders to improve their ability to gather and manage data in a way that improves their ability to track impact and improve their bottom line.
Museum Examples
The SEATTLE ART MUSEUM’s installation Mirror, by Doug Aitken, uses responsive editing software that tracks weather, traffic and atmospheric conditions and renders them as images projected onto 12 stories of the museum’s façade, pulling from hundreds of hours of footage Aiken filmed around the museum, city and state. The pixels in the logo on the webpage of the NEVADA MUSEUM OF ART change color throughout the day and the seasons, taking on hues determined by the previous hour’s temperature information in Reno. This dynamic image, driven by environmental monitoring, gives form to data that pertains to the museum’s Art + Environment oriented identity.
Some museums are already using data analytics to hone their operations. HISTORY COLORADO and the POINT DEFIANCE ZOO & AQUARIUM are both working with IBM partner organization Bright Star Partners to capture visitor-related data from point-of-sale systems (admissions, store, food service) and analyze it in real time.This data enables the organizations to make efficient decisions about staffing and use of space, and tailor their membership programs, pricing and communications to the demographics and behavior of their audience. In the near future, the zoo intends to enlist the Near Field Communication capabilities of smartphones to encourage visitors to “check in” as they move through the grounds, which will help managers assess the popularity and dwell time of particular exhibits. The DALLAS MUSEUM OF ART uses Chartio for real-time analytics of patterns of membership sign-up and visitor use of the museum.
As data becomes more valuable, it becomes, in effect, a kind of currency. Even museums have cottoned on to this: early last year the DALLAS MUSEUM OF ART introduced a membership model that invites visitors to trade personal data for a “free” basic membership. The DMA’s membership structure is designed to capture as many people and as much data as possible. The information they collect includes Zip-plus-four, which they can cross-reference with Census data for a demographic snapshot, and real-time data from cards that encourage members to “check in” to galleries during their visit. This enables the museum to engage with members in a more interactive and personalized way, and to compile a detailed and compelling story to tell funders about whom the DMA is serving, how they engage with the museum and what they learn.
Big data has an aesthetic side as well. THE ALBUQUERQUE MUSEUM OF ART AND HISTORY features Agnes Chavez & Alessandro Saccoia’s (x)trees—a “socially interactive virtual forest” generated from search words found in tweets and text messages, making it an experiment in data visualization, video mapping and participatory art.
Further Reading
Rick Smolan and Jennifer Erwitt, The Human Face of Big Data (Against All Odds Productions, 2012, 224 pp.). This impressive coffee-table sized book presents images, essays and articles based on the conclusions of the Human Face of Big Data Project, which used a free mobile app to create a week-long “snapshot of humanity” from information contributed by over 300,000 participants worldwide. (Merging print with digital media, the book uses the Aurasma mobile app to trigger video and other content by using a smartphone or tablet camera to read icons on selected pages.)
Anthony Lilley and Paul Moore, Counting What Counts: What big data can do for the cultural sector (Nesta, 2013, free downloadable PDF, 3.77 MB).
Tony Hey, Stewart Tansley and Kristen Tolle (editors), The Fourth Paradigm: Data Intensive Scientific Discovery (Microsoft Research, 2009). Available as a free download from Microsoft Research, this collection of essays explores how data analytics will shape 21st-century research.
Paving the Path to a Big Data Commons (World Economic Forum and Vital Wave Consulting, 2013, free downloadable PDF, 7 pp.). This briefing explores personal data and how issues of privacy and data ownership can be balanced against the good that can be realized from the open use of such data.
Phil Simon, Too Big to Ignore: The Business Case for Big Data (Wiley and SAS Business Series, 2013). Presents an overview of how businesses and municipalities are using data analytics to make “astute and otherwise impossible observations, actions and predictions.”

Upcoming Events
-
Confessions from the Security Vault
Event Date:Presented by: Southeastern Museums Conference -
From Fragmentation to Alignment: Project Management in Museums
Event Date:Presented by: American Alliance of Museums -
Unlocking Your Site’s Membership Potential
Event Date:Presented by: American Association for State and Local History (AASLH) -
CEO Chat: Censorship
Event Date:Presented by: American Alliance of Museums