View a recording of “Starting Evaluation with Team-Based Inquiry,” a webinar presented by the Committee on Audience Research and Evaluation on March 11, 2020. Presenters from the Minnesota Historical Society and Como Park Zoo and Conservancy share a useful framework for engaging all types of museum staff in evaluating specific programs and organization-wide efforts.
Transcript
Sarah Cohn: Recording now. But thank you so much for coming to the second CARE-apy webinar, the Committee on Audience, Research, and Evaluation, a professional network of AAM is trying this year between last summer and this summer, trying out different ways of connecting with all of our various members and sharing expertise and creating space for people to ask questions. And so CARE-apy is our version of evaluations therapy. And we will be talking today about team-based inquiry. The presenters are myself giving a bit of a background of what team-based inquiry is and how it came to be. Sheila Brommel from the Minnesota Historical Society will be talking about MHS’s use of TBI. And this really came out of the last CARE-apy webinar because Sheila shared some elements of team-based inquiry.
And so we decided to just spend some time specifically focused on it. Apparently I went with Minnesota style this month because Becca Hans and Alexis Swan from Como Park Zoo and conservatory are also going to be talking about how they’ve been using team-based inquiry to do some different work at the zoo. Please share any questions that you have as they’re coming up for you in that chat box and we will get to them as we talk through this. We’re also going to have about 20 or 30 minutes at the end for just a general discussion across everybody and anything that’s coming up for you, so you can hold on to any questions you have for that point as well. But we’re hoping to share some of our experiences a little bit about what this model is and then really just open it up for discussion. Anything else Sheila, Becca that you think I should share?
Sheila Brommel: Not yet.
Sarah Cohn: Not yet, Perfect. It’ll come, there will be a moment.
Sheila Brommel: It will.
Sarah Cohn: Fantastic. All right. So I’m going to give a little bit of a background of what team-based inquiry is. Again, my name is Sarah Cohn, I was the former chair, I am the former chair of CARE and an active member of CARE. And then I am from Aurora Consulting, that little triangle at the bottom. And team-based inquiry was created, I feel like a long, long time ago, now it makes sense. But within Science Museum project, it was two five-year grants from the National Science Foundation. And that project was focused around teaching the public around nano-scale science. But one of the things that they did was do a lot of professional development and creating processes such as team-based inquiry that museum professionals could use beyond the life of that one grant and that one content area to really help think about how do we produce programs on the fly? How do we make sure that we’re really achieving the goals and the outcomes that we’re setting for ourselves and so on?
So team-based inquiry was one of the things that came out of that project. Its formal description is this one, really thinking about how do we as professional evaluators who are sometimes scattered across museums, if we exist at all within our museums, how do we give other museum professional the tools, the processes, the structure that they need to be able to get information in time for them to make decisions and take action? And that’s really how team-based inquiry came into being. It is an accessible approach to evaluation that really kind of fits into the way that we think about developing new projects, the way we think about trying to solve problems or answer questions that we have for ourselves.
If you know about action research, if you know about participatory evaluation, then this iterative cycle is something that is not new to you. We actually drew from a lot of different forms of evaluation and of research and just how does the human brain function to develop a process that makes people and particularly non-evaluation professionals able to help gather information that will help them make a decision? Figure out which direction to move when faced with a fork in the road or really just figure out which of the many dreams we have for new experiences we’re going to run with first or second. Some of the other really big pieces about team-based inquiry are these bullet points on the hopefully right hand side of your screen.
As we move from thinking about the fact that we have a lot of just bits of information we may hear from families or from colleagues, team-based inquiry was trying to create a system of gathering all of that so that it’s systematic and we can say, “We have heard X, Y, Z. This is how we’re going to move forward,” based on that. We also created it so that it was team-based, the fact that you might not have a full-time evaluator on staff or a friend that you can call who does evaluation, use the brain trust within the team. And that team can look many different ways to help figure out what are the things that we need to know to be able to move forward.
The idea of polling multiple people together who are invested in a project really makes this process and the information you gather really robust and strong to help you make decisions and move forward. But at the same time, it’s small-scale and focused. If you have a question on Monday, you could potentially answer that question by Friday. We’re not thinking about multi-year large research studies about impacts in third grade on high school achievement, we’re thinking about if I create a program or a fundraising event in this way, will it have these outcomes that I am hoping for for people who participate? If I shift piece A with piece B, does that have an influence on how people walk away from that experience? Really small things that help you make decisions in your day-to-day work.
To give you a really brief overview of the process, the four big areas of the process are the question phase. You can start at any point, but this is often where people start with … Oh, I see some issues here. Does everyone see a big white screen with a question at the top left? Hopefully.
Sheila Brommel: I see it.
Sarah Cohn: Fantastic. Thank you. So the question phase is often where people start, but if you have a stack of surveys that you haven’t looked at in a while, you could start at a different point in the process. But the easiest way to enter this and think about this cycle is starting with the questions phase. And that big thing, this piece is really thinking about what are the big questions that you need to answer to help you make a decision or take action on something? They’re not the questions that you would ask a visitor or a colleague. They are the questions that are guiding and framing the kind of work that you are doing. So for this example we say, how can we improve? Really broad general question, but how can we improve the work that we are doing to achieve the goals that we have?
I’m going to share a link with you. This is access, I shared a link in the chat. You can click on that hopefully or copy and paste it out and this will give you access to all of the resources that have been created. Everything that I’m going to walk through here is available for free online. And there are also videos through that link that you can use. But to help teams go through this, we’ve created this questions worksheet, and this is really to help people think about that big picture inquiry question of how can we improve and probably the litany of other questions that you might have.
Often when teams come together and are building something new, people come from different perspectives, which is the strength of that brain trust. But they have a lot of different questions based on those perspectives that might not always be exactly the same as each other. So this worksheet is helpful in getting people to understand and talk through as a team, what are all of the questions that we have and which ones are the most important for us to answer right now versus perhaps in our next version of the cycle?
And this document, this worksheet is available online. I’m going to go to the next slide. This questions phase is really focused on setting the stage for the team and for the work that you’re about to do, identifying what are the one, two, maybe three questions that you have that you want to try to answer to move forward? And all of that will help guide you through the next few steps of figuring out what is the information we need to gather, what are those questions we need to have on a survey or in an interview script to help us answer those big questions? So it’s a great space for framing the whole process and understanding, starting to explore what you might be getting into.
The next piece is the investigate, and this is where you create the instruments or data collection materials, find them online, and formalscience.org is a great resource for finding instruments that already exist or tools that you could use or modify. And then going out and collecting the data or sending the email to send the survey and gathering information. I’m going to skip my next slide, just watching our time. Once you have all of that information, we’re then moving into the reflect phase, which is making sense of it. And so I jokingly said you might have a pile of surveys, I have definitely heard stories of people using previously filled out surveys to boost up their computer monitors or just to help sort stacks in their office.
If you have that, you can jump into the process here and say, “Let’s explore what this pile of information might tell me.” You can turn it into usable data. So the biggest piece is manipulating it, getting it into a digital form. If you haven’t started with gathering data over email surveys or handing over an iPad or a tablet to folks to fill out or emailed you back responses, you may have to type it all up. And then as a team you go about sorting the information. So this picture is an example of a team looking at written responses to open-ended questions or notes about what families were doing, observing and sorting them into different buckets of what does this information tell us? What are some of the patterns that we’re seeing here?
So this is the biggest piece, and it’s often data collection can take a lot of time, which I’m sure others will talk about. But then this is often the most time intensive for the entire team because you want everyone to understand both how you went about collecting the information, and then what does it mean? What does it say, and what does it mean to us in terms of going back to those big questions that we had about the work that we’re doing? So spending time, reading through everything and then sorting it and understanding what are some of the patterns that are going on can then guide you into the improve phase of identifying, okay, this is what the information says that, and this is what we’re starting to understand about what it means to us, now how do we take action on it? How do we go about making a decision or running forward with the one clear winner for a title of an exhibit.
This document, which we can share with you. I actually got from Sheila, the Historical Society because it was a way that, and you’ll see this in action in a couple of moments, the way that she took her teams through the process of understanding, here’s everything that the data says, now what does it actually mean for the work that we are going to do? How do we identify the pieces that are extremely successful we want to move with? Where the areas for growth? And now with all of the ideas we have about what changes we could make or what decisions we could have, how does that scale out on terms of what kind of impact a shift would do and what would it cost for us to do it? And thinking about the cost both in terms of financial resources but also time and attention and what might it take to logistically shift pieces of an event that you are doing?
And then the last big piece, and I’m going to hand it over to others is writing it up. So one of the things that we have found is that a lot of institutional knowledge, personal knowledge is lost between people and across teams because we don’t write down the things that we have learned. Whether something was successful or less successful than we like, being able to write it down and share it with others is particularly important. So this is both with what kinds of questions you write in the survey and how you went about collecting data and then also showing the iterative changes that you might make to something as you’re building a program or an exhibit.
So that is the full cycle in high intensity, fast paced description. We can come back to all of these, but I think the thing that is really most useful I have found is people being able to see and hear examples of what this looks like. And so I’m going to actually pass it over to Sheila and skip the last couple of my slides and we can come back to them later if they’re helpful to give you all an understanding of what this process and this cycle can look like in action. So Sheila, I’m going to pass it over to you.
Sheila Brommel: So am I able to advance?
Sarah Cohn: No, you tell me.
Sheila Brommel: Okay, go.
Sarah Cohn: Go.
Sheila Brommel: So this is a repeat to remind you of the four phases of TBI. And we have used all four phases, we use the question phase to help different teams figure out what it is they really need to know about something in order to advance their work. And we try to figure out the best way to collect data to answer those particular questions. But in general, we’re pretty good about collecting data. Where we were less astute was in actually carving out the time to reflect on the data. And it wasn’t because we didn’t want to, it was just a matter of being busy with 100 other things going on and taking the time to get the team together to sit down and actually look at the data together and think about what it means for us and what we could do differently based on what the data was telling us. So the examples I’m going to give you today is primarily about how we’ve used this to reflect and improve on the data. So Sarah, skip ahead.
One thing that I do, we use SurveyGizmo for our surveys and SurveyGizmo will create a very long clunky summary report. A two-page survey can turn into a 30 to 40-page report depending on how many open-ended questions you have in there and how many responses there are. And I condense that into something that I call a dashboard report, and I kind of condense all the information into maybe four or five pages. This is kind of hard to see, but really trying to summarize and condense the quantitative data. I will give examples of quotes if there are open-ended questions. But this is kind of a shorter summary dashboard type of report that I will share with the team. And it gives them a way to get a quick overview of what the survey data is saying.
And Sarah, if you would click ahead. And so then we will create a Google doc, and this is kind of our version of a TBI summary form. Not quite as nice as the outline that Sarah had, but it’s our attempt to record and document everything that we are talking about. And for the reflect phase, I’m bringing the team together and I’m asking them to think about what findings do you see that are particularly successful? Because I think it’s really important to recognize what is working well, and we definitely want to celebrate the successes. But we also then want to look at the flip side of that coin, what findings might present an opportunity for improvement? And then that will take us into the improvement phase where we actually brainstorm, okay, what are some possible things that we could do if we want to …
Sometimes it’s maintain. If we’ve gotten good ratings, we want to keep it going. So what do we do to make sure that we maintain these good scores? Or if we want to change the direction of some of these scores, what do we do differently? And then we prioritize by cost and impact. And then we create an action plan where we actually specify who’s going to do what, when, by what date and then provide a space for reporting on status update kind of thing. So this is the basic outline of this Google doc that talks about what we see and what we’re going to do about it.
And what I found when doing this reflect phase, I would share this form ahead of time and I would still get people who would have kind of a glazed look in their eye when I would present them even with the shortened dashboard kind of report. If they aren’t used to looking at data, they sometimes didn’t really know what to look for. And so I’ve started kind of pre-filling out this form and letting them know what I saw that I thought was successful, and then I turned it into a conversation, what else did you see? And are we seeing the same things? Maybe what I saw wasn’t necessarily a success, maybe it’s something that they would have moved to the improvement category.
So Sarah, if you want to do the next slide, I’ll show you what that looks like. So I would kind of summarize, and intentionally I would make this list pretty long because there’s usually a lot to celebrate. So if 97% were having an excellent or very good experience, net promoter score was very positive. I would kind of summarize the open-ended questions of what people were liking. Boy, there were 42 comments people saying there’s nothing to improve. Everybody was saying this is good, this is great. The GD means they like this a great deal or quite a bit, very satisfied and satisfied with this and that.
So a lot of things to celebrate. And when it came to what the guides or the interpreters were doing that people said 95% of the guides liked this or showed knowledge of the subject, provide a good customer service. I would especially point those out and remind people to let the guides or the interpreters be aware of that, share this data with them so they are aware that they’re doing a fabulous job. And I would really make a big deal about the part that is working well.
And then we would move on to the next section, what might be areas for improvement? And here is where I would point out what I thought were maybe lower scores, maybe something under 50%. I would have the benefit of being able to look at other programs or other historic sites so I could maybe compare with others and see if they were doing not as well. I would pull out some of the comments from the open-ended questions, put comments in there. And then I would always take it back to the team, what else did you see and what else from your experiences might you add to this section? And generally, people would say, “Yeah, this looks right, this makes sense based on what I saw and what the data is telling me.”
I didn’t really like pre-filling this out beforehand, I really wanted them to be the ones identifying what was success and what was an area for improvement. But I needed to get it started, get the conversation started. So I found that it turned into more of a discussion if I filled out with a few things to start with. And then the next slide. Then the brainstorming part, that’s probably my favorite part of the activity because I encourage people to think outside the box. Don’t constrain yourself. If you could do anything based on what the data is telling you, what would you do differently to improve the visitor experience with their general daily experience? And I number all of these, and they just go to town and they are thinking out loud and just coming up with any idea to address the things that could benefit from improvement or doing something differently. So we’ll generate the list.
And then the next slide, Sarah. Then I take those numbers just because it’s easier rather than repeating everything, but I ask them to prioritize by impact and cost. And as Sarah mentioned, the cost is in terms not only monetary but also in terms of time and just the staff cost of attending to something. And the purpose of this is because we all have limited resources, we can’t do everything on our wishlist all at once. So this is to help give us an idea of where we can start. If something is going to have high impact and a low cost, that seems like it’s a no-brainer. Let’s start with that section first. If something is a low impact but a high cost, let’s not do that one. And if something is a high impact, high cost, it doesn’t necessarily mean we’re not going to do it, but it may be means it’s going to take more time, more planning. Maybe it means that we need to go to our development department and see if we can write a proposal to some funder to find some money to do a new program idea or something like that.
And I saw there was a question in the chat, what percentage of response do you consider for the areas for improvement? We don’t have a percentage per se. Something that might be a red flag for me or where I might go first is if it’s under 50% just because I think that’s less than half, but I also look at a baseline. If we have previous data, I to see if numbers are going down, and do I want it to continue to go down? Maybe it’s a lower number anyway, but that’s as high as we can get. And that might be okay. It’s really a discussion with the team, what do they think is a reasonable number?
I hope that kind of answers the question. That’s why it really is a discussion and not just me picking out something because what I view as an area of improvement, it might already be an improvement from the previous year. They would know that better than I would know that. Here’s our prioritization grid. And then from here, we go to the action planning on the next page. And really this serves just to get it down in writing and to provide accountability. If we don’t assign a name to it, it’s like who’s going to do it? Who’s going to get it done?
And there’s nothing that feels better than coming back to do a status update and being able to write done in this column, especially when you can put it in all caps and all bold, it just feels really good. Now, this set of examples was done two years ago. We’ve now done a second round of this general visitor survey in our second round of TBI. And I actually use the same document and did a new dashboard report where I added the second year data so you could compare 2018 with 2019. And they could see then the changes between the two years, and then I ended up deciding to use the same TBI document and show the changes side by side on this as well. And then when it came time for the action plan, I left the old one in here, and then I asked the team if they wanted me to delete it or if they wanted to just add onto it and keep some of the same things because some things hadn’t all been completed and they might still be relevant.
Some things are kind of a process, kind of a never-ending process. And it helped show where they had made movement and where they were still at in the process, that there was still work to be done. And they opted to keep it and to show that they were still working on it, but they had still made progress. So they liked having this kind of record of accomplishment. And the last slide that I had was just to show the homepage for the TBI guide and the resources that are available. The tools are fabulous, you can download. But the beauty is that you can customize them to suit your needs. If it doesn’t work as is for you, you can make adjustments and make it suit your needs. That’s what I have.
Sarah Cohn: Fantastic. Thanks Sheila. I have some questions that I’ll throw out in case others in the room don’t have any later. But one I wanted to ask now is how long are these meetings where you go through the reflect on the data and then identify possible solutions and prioritize?
Sheila Brommel: Say that again.
Sarah Cohn: How long is the meeting that you have with teams to look at the data-
Sheila Brommel: Typically two hours. So that was part of our problem, we have to be efficient with the use of the time because it was really hard to get all the relevant people in the room at the same time. That’s why they weren’t looking at the data in the first place, nobody had time to do it. So if I can promise them that we’ll get through this data and come up with an action plan in less than two hours, they can commit to that.
Sarah Cohn: Nice. Awesome. Thank you. So we’re going to hand it over to Becca and Alexa.
Becca Hans: Thanks Sarah. Can everybody hear us okay? So my name is Becca, and I’m here with my colleague Alexa. And actually I’m going to try to make sure that, can you see Alexa, are you in the screen? We are teaming this presentation just like we do everything around here, we are a department of two. We’re going to try to keep this pretty high level, but we’re doing some really exciting word work. And Ellen, Sarah have helped us along the way pretty dramatically. We are in the process of an initiative called the ROADMAP. And we incorporated TBI into the program development process, which is part of that ROADMAP initiative. So Sarah, if you could advance.
So just to understand a little bit more about what we’re talking about, ROADMAP is something that was first developed by the Denver Zoo. And it stands for Reaching Our Audiences by Developing Mission Aligned Programs. And basically the heart of it, the suite of best practices for engaging visitors through focused and impactful programs and experiences. And there are several different elements to it, but the one we’re discussing today is the program development process and resources. And so the ROADMAP from Denver came with really wonderful training, something called program content standards, which helps people focus in the content of their programs. And then a development template, which helps them craft the program.
And program is pretty loose here. So we’re talking about staff that create programs for education purposes, education department, interpretive departments as well as our keeper staff and gardener staff who create curts for the public. So a program can be any one of those things. And then we worked with Ellen and Sarah to add a mentorship program as well as infusing team-based inquiry into the process. So that’s what we’re going to be talking about in advance. Thanks.
So what we wanted to show you first was the team-based inquiry slides that we included in our ROADMAP training. So we did introduce the idea team-based inquiry, which now you’ve heard several times, but introducing the cycle of question, collect, reflect, improve. And the main idea that it’s a research-based best practice that someone didn’t just make it up, but it’s based on research. And also that it’s about people working together to get the data they need when they need it so that they can make improvements. Go ahead, Sarah. So this next slide introduced all of our program developers to how we would use TBI in the practice of program development. So first of all, all program developers team up with a mentor to help them through the entire program development process, including this section of TBI. And of course it does vary depending on the program and the developer. But in general, this is what it looks like.
So the first step was our question meeting. So once a program developer had created a really good template of their program, they would share that draft with one of us. We were both mentors. And we would have a meeting to develop inquiry questions. All programs have outcomes that they developed for the audience. So we were always going to have inquiry questions around how strongly are your outcomes coming through in your program? But then we just wanted to know from the developer, curious? What else are you curious about and what data can we collect from you when we come observe your program? So that was the first meeting that we would have with the developer after they had finished their first draft of the program. Then we would attend the program. So we would be there as data collectors, we would observe the program and collect data only on the inquiry question that the program developers had.
So we were not there for any other reason except for to get them more information to help them improve their program. And then afterward the observation, we would have a reflection meeting. And throughout all of these meetings, the question meeting as well as the reflection meeting, I’d also like to highlight that we infused this a lot with focused conversation. So this is something else that came down from Ellen and Sarah that we really appreciated where we asked a series of questions that were objective, reflective, interpretive, and decisional. And that really helped guide all of our discussions, so we didn’t get too off track. And if you want to know more about that, you can ask Sarah at a later date. But that really helped us with these discussions. So at the reflection meeting, first the shares their own impressions of how they think the program went and then we would actually share the data that we collected for them.
And then we have a discussion about how all of that data aligns. And if there’s anything that’s in their control or out of their control, and then whatever’s in their control, what possible tweaks or program improvements would they like to make? And then we have that decisional discussion about next steps and what is your plan, when are you going to take those actions? And then that final step of improve. So if they did choose to make any improvements, they would go ahead and do that. And then in theory, the process is complete. But of course, developers always knew that they could repeat the process at any time. So that was in theory how we presented it to them.
Next slide. And we also had this slide about common concerns. So when we had first created the ROADMAP program development process, we also did some of our own TBI. We actually had user testers where we tried everything out and got data from them to improve the program development process. And we wanted to share some of the common concerns that we heard from those keepers and gardeners and educators about TBI and how maybe they don’t have time to do this extra step of evaluating and collecting data and then making more improvements. There were also concerns they just don’t want to be observed, that they felt like it might be a critique or that they were being assessed on skills or that it would be judged.
And then they also had concerns that if we’re coming to see a program, maybe it’s not perfect yet in their minds, which is fine Or maybe something unusual happens or they were off their game that day, and then that would somehow ruin the process of TBI. And so we just made sure to let them know that it’s not a performance review, it’s not a checkoff, it’s not a skills assessment. And that if we observed a program, if we have usable data that the program developer said, yes, this data is usable and I can take something from it, great. If it was a total lash, we’ll scrap it and we’ll do it again another time. So just reminding them that it was a tool for them as part of the program development process, and it really wasn’t about us and there was no secret agenda. Go to the next slide. All right, so now Alexa is going to jump in and just share a few examples of how program developers used TBI and some of the inquiry questions and data that came out of it.
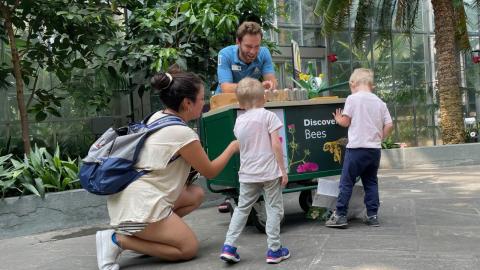
Alexa Swan: Yeah, so you can go ahead to the next slide, Sarah. So the first example that I wanted to bring up was one of our gardener talks that was about bananas. So this was a program that already exists, it’s a 10-minute talk where anyone that’s walking around on campus can come to this 10-minute chat with the gardener about bananas. And so going through TBI with one of our gardeners included talking about the outcomes that I was going to look at when I came to observe program. But then the question meeting to pick what additional inquiry questions that she might be interested in me looking for when I came to the program. So you can see here on the screen one example of one of the inquiry questions that we came up with.
And I would say that as we keep doing it, I try and focus more heavily on … People will bring up ideas like I am curious about engagement, how engaged is my audience? I don’t want to be boring, that kind of thing. So then me having to make sure that I frame the conversations. So what am I actually going to look for when I come and observe? Because engagement can mean different things to different people. And what am I as an observer there with a sheet of paper and a clipboard actually able to deduced from observing the program in terms of what they want to know? So you can see that the question on the screen is more specific than just is my talk about bananas engaging. So she had a particular question about the content level when talking about the life cycle of a banana plants. And things I might look for is myself as an example of a general audience member if I get the contents, that’s some data points. And then observations, like are people literally leaving at this point during the program?
So then I would complete the observation template when I came and watched the program. And then typically we would try and meet right after the program, which is what I did in this case. So you can see under the observation columns just some of my notes that I took and then shared during our reflection meeting. So the two of us sat down, she shared her perspectives, and these were some of my notes. Vocabulary that I personally didn’t fully understand when watching, things that I did understand, audience trends that I noticed. And then from there we moved into using the focus conversation questions for what now improvements could we possibly make. And again, like Becca mentioned, what was in her control or not and using that to narrow what should I actually focus on changing for the next iteration of this program. All right, Sarah, you can go to the next slide.
So then the second example that we wanted to throw out was a special events weekend. So this was, again, in our public space where we would have several tables and volunteers there. And there’s a theme for the weekend. So this event would happen during our public hours over the whole weekend. And so meeting with this group of developers, again, question meeting in addition to your outcomes for the program, what are you curious about? And one example that they came up with was they were curious about the volunteers’ experience because they changed some of the materials that they used with the volunteers. Cool, that’s something that could observe for.
So then again, you could see some examples of what observations we can make to give us information about that question. And then again, under the reflection column, you can see some of the ideas of how we use that information to then make changes moving forward. So in this particular program, basically they were curious about how the volunteers would feel about this change because change can be hard. And basically, there was lots of observations about how positive it was and that they were using it and saying that they really enjoyed it. So then there was lots of reflection around how to continue to use it and to even do more with it in the future. All right, go ahead, Sarah.
All right. This is our last slide just to kind of sum things up a little bit. So as far as how TBI impacted our program development process and the developers using it, we just observed a few things. So program developers really thoughtfully reflected on the data to make meaningful improvements. They really did see meaning in the process and used the data intentionally to make improvements. There wasn’t a lot of people dismissing the idea or not dedicating some time to it. We thought that was really great. And then several program developers asked to do a second round of TBI. So they saw the benefits, they saw the tweaks they wanted to make, made those tweaks and then had further questions, new inquiry questions, and wanted to try it again to further improve their programs.
So we thought that was really a great indication of success. However, we’re also doing our own TBI cycle on the program development process. So we’re going to be bringing all of our freshmen program developers as we’re calling them into an interview session to get data on how the process was for them so that we can ourselves make improvements on the process going forward. So lots of layers of TBI. And that’s all we have for you.
Sarah Cohn: Awesome. Thank you so much. So folks start thinking about typing up questions that you have or you can unmute yourself and ask. And while they’re doing that, Becca and Alexa, are you all full time evaluators? How much of this did you know how to do? How much did you learn by doing? Just thinking about who might be on the call.
Becca Hans: Yeah, no, we are not full-time evaluators, we are both educators. We did not before this have any good experience doing evaluation. We did hire this great firm called Aurora Consulting [inaudible 00:44:16], Ellen and Sarah. You guys have been helping us a lot with this project. But really, one of the keys for us with embedding this into the work that our educators and other staff do is the TBI. It just melded really well and made it really easy and part of the process. I think a lot of us educators or entrepreneurs know we should evaluate our programs. But we actually intentionally built it into the process and so it made it easier for people to feel like they could find time to do it.
Alexa Swan: The focus on it being systematic and intentional, like this is just a thing that we do every time that we’re developing a program and so it’s a really critical part we just do every single time that we do this work.
Sarah Cohn: And how have you seen some of that just start like embedding itself in practice? I know that you all started doing TBI of your own to even build this process, you did it in your own ways. Are there some pieces that feel like are really natural alignment with the way that you think about creating educational programming and some pieces that are harder? What’s that been like for you?
Becca Hans: Well, we did do a capacity building training with you all. So we brought you in to train more of our staff on TBI so that they could see how it could be used outside of the ROADMAP program development process. And I think that there was a lot of interest, but I think where people got stuck was things like, well, what else could we do besides the survey? There’s a lot of questions around what are the right questions to ask? And this idea, oh, we want to ask questions to get the data so we can actually use the data to make a change instead of just asking a question because we’re supposed to have a survey after every program that we do.
Becca Hans: And so I think there is just a little bit of a paradigm shift for a lot of people, but they’re starting to see potential in how they could apply it outside of the ROADMAP and in their own work and even outside of education. Now, that’s a little slower to take on just kind of responding to that question there in the chat.
Sarah Cohn: So Sheila, do you want to take Maria’s question? And I can even pull up the little slide I have in terms of ways that it could be used across departments.
Sheila Brommel: I’ve used TBI in a range of areas. I’ve used it with volunteer services. We’ve done a couple of different surveys. And I always start with, what is it that you need to know? And so we will do a questioning exercise starting with post-it notes, what do you need to know to move your work forward? And have people brainstorm on post-it notes and then sort those into overarching evaluation questions. I’ve used that with the exhibit team when they’re wanting to kind of do their own mini strategic planning session within their department. I’ve used it with membership as they’re getting ready to do a membership survey. I’ve used it with our diversity inclusion department, even had the pleasure of doing one of my more exciting surveys with our facilities and risk management team looking at hazmat questions. I don’t even remember those questions. But yes, that was interesting to say the least.
Becca Hans: Sarah if I remember from your TBI training with us, something that you said that I think really resonated with people that TBI is something we naturally do in any means anyway. We ask a question, we see what data’s around to help us answer the question, and then we make some decisions, et cetera, et cetera. And so I think just helping people realize that evaluation is some mysterious, separate thing that we do it already. And so TBI helps you do it more intentionally so that you target it and get accurate information that you can make a confident decision based around. So that works in any field, in any department with any decision you’re trying to make.
Sarah Cohn: And just to expand a little more Maria’s question, I think the original definition of team-based inquiry, it was to empower museum professionals to get the data they need. And I’ve expanded it well beyond museums or even program specific kind of work and organizations. As Sheila said, she used it with her diversity engagement department. And the thing that’s interesting about using this process in areas or with teams that might not be so specifically aligned with an individual moment like sitting in a program or participating in an activity or walking through an exhibit space and then you’re done is that it opens up conversation for a lot of different questions about the way that we work to create our membership structures or to build our marketing plans and starts to uncover some of the assumptions about who visits, becomes members, who becomes donors. How do we engage, and how do we fit within our community where there may be some really bigger questions but also really actionable active team-based inquiry cycle work that you could do.
One of the notes that I had was having that questions conversation, and both of you said that when you do work with teams that you really focus on what are the questions that you have, what’s the thing that you’re doing, and what are the questions that you have about it? Really helps both broaden and then focus, like what can we gather information about to help us?
Becca Hans: We just recently started using TBI to help us make decisions about a new hire orientation. So we brought the leaders together and used TBI in this conversation to make some decisions about how then the two of us would go forward with that. So yeah, it comes in handy. And you can use it in almost any situation.
Alexa Swan: And you can include different people at different steps in the process, it doesn’t have to be that the team is the exact same team for all four steps in the process. And I think that’s super helpful and freeing too to think that you’re not just trying to craft one team that’s going to be able to meet all the time at every step in this process. But like Becca said, it might be a lot of people for the question meeting and then we might do a step by ourselves and then bring it back to a larger group.
Sarah Cohn: I think Julia and Chuck’s questions are kind of connected a bit here of how do you get people involved when they might not want to be or feel like they need to be. And then even like at the management or director’s level, how do you get buy-in for starting and initiating this process? What have been things that have worked for either of your organizations?
Sheila Brommel: This is Sheila. I would say that I tend to work with a team leader on a case-by-case basis. I think they tend to approach me when they have an identified need. And so that team leader is typically the department head or some mid-level manager. And so they identify who they want on their team and whether or not that team member has buy-in, they’re there because their boss wants them there, and they’ll kind of maybe fake it whether they have buy-in or not, and maybe sometimes they succumb to peer pressure. Maybe they don’t totally agree or maybe they will agree to parts of the conversation.
I think generally they end up being curious and they end up finding bits and pieces that they will agree with. I think I can usually warm them over with the celebrating successes part of it. And then the opportunities for improvement is easier, an easier sell. And typically, I think there may be some small part that they want to improve anyway, and so they’ll find a way to fit it into that action plan for improvement because they know that that’s where the attention is going to go, if that make sense.
Becca Hans: This is Becca. I have two thoughts, that first question about what if they feel nothing is wrong with the program. The thing think that really worked for us. I don’t know how intentionally we did this, but it wasn’t about we’re going to do this to see what’s wrong with the program. We did this as a, what are you curious about? What are you interested in? What are you learning more about? Especially framing it from, as a presenter, you’re not always able to pick up on all of that data when you’re teaching a class or giving a talk. And so it wasn’t necessarily what’s wrong with it to make improvements, but just what are you curious about? What do you want to know more about? And then let’s look at that information and then decide if anything needs to be tweaked or not.
It might be fabulous, and that’s great, but now we have concrete data that we are confident this is a really successful program. And then as far as management or just other buy-in, the ROADMAP was a campus wide initiative. We did do change management for the whole initiative to get people to buy in. But also sometimes people, they had to do this with us, and so we dragged them along. But then it was once they did it once, they saw the benefits. Once they go through it once, they think they see the benefits. Now, we’re doing TBI. With the new hire orientation, we had to meet about this anyway, I just snuck in the process of TBI into those meetings and some of the processes and the questions into that. We were doing it anyway, and I don’t even know if they knew I was using TBI. It’s just a way for me to approach working with that team.
Sarah Cohn: Another way of thinking about this cycle and continuing to expand on where does it fit or how do you bring people along, drag people along in Becca’s words, not mine is if you are either a manager, director, leader of a department or a team or if you sometimes lead team meetings of whatever kind and you go about asking the question of the group, brainstorming a lot of ideas, finding where there’s synergy and energy and then making a decision. That is itself a team-based inquiry cycle because you are gathering information and making a decision. And it’s all happening within the same group. But it is that iterative cycle that, it is that cycle of posing a question, getting information that helps you make a decision to move forward.
So if you’re able to find ways of creating parallels like that to other ways that you might work in your departments or across departments in working groups, it could be a way to say this is not different, it’s not so different than how we go about deliberating over the next big thing or how we’re going to create next year’s budget. It’s just about there are some pieces where we have to gather information from people outside of this room or outside of the formal team to figure out the best way to move forward or to decide what to do.
And that’s related to what Becca said earlier of this cycle of questioning, collecting, considering, and deciding is a part of just the way that our minds work. Whether it’s looking at a menu or making a massive strategic plan for the entire organization, it’s related and hopefully you can find ways of bringing people along by showing those connections. And really in all of the documents, if you go to that website and look at the guides and stuff, we are very deliberate in saying this is not about staff assessment. HR does not use this, managers do not use this for annual reviews. This is a very different process than that. And so holding true to that is really helpful.
So we have two minutes left. I don’t know if others have more questions. But wanted to share that our next CARE-apy will be Wednesday June 10th. And we’re going to be talking about writing outcomes so that you can go about gathering data. And so if that’s of interest to you, same time June 10th. So after the annual meeting. If we are all collectively healthy enough and you are funded enough to head to San Francisco for the annual meeting of AAM CARE, we’ll have CARE-apy space and we’re going to have different topics over the course of the annual meeting in the exhibit hall. So we’ll share more about that in the coming weeks as well. All I’m seeing are thank-yous in the chat. So we’ll hang around and answer more questions if anything comes up for you. But thank you so much for your time this afternoon and have a great March.
Upcoming Events
-
What It’s Like to Participate in Museums Advocacy Day
Event Date:Presented by: American Alliance of Museums -
From Idea to Acceptance: How to Submit a Winning Annual Meeting Session Proposal
Event Date:Presented by: American Alliance of Museums -
-
Climate Change Education Virtual Summit
Event Date:Presented by: American Public Gardens Association & the United States Botanic Garden