Essential Evaluators seeks to gather evaluators in a common space to dialogue, reflect, and support each other in a world upended by COVID-19 and the Black Lives Matter protest movement. This is a time of uncertain and unknown expectations in our professions, in our institutions, and in our communities. We invite you to join us as we rethink, revision, and ultimately redefine our roles as evaluators and our place in museums.
This week, it is our great pleasure to welcome Michelle Moon, a highly respected leader in museum education and community resilience, as guest blogger. Michelle has spearheaded an important grassroots movement documenting the economic impact COVID-19 poses for museums, particularly as it affects employment and staffing. This work highlights the essential role of evaluators.
Other posts in this series:
There’s a term that describes the difficulty of understanding a crisis in the midst of it: “the fog of war.” Coined in 1832 by Prussian military analyst Carl van Clausewitz, it describes the challenge of assembling a big picture in a chaotic, fast-changing environment. In these contexts, information is essential—yet, Clausewitz wrote, much of it is “contradictory, a still greater part is false, and by far the greatest part is of a doubtful character,” of which creates the “difficulty of seeing things correctly.”
COVID-19 surrounded museums with something like the fog of war. Within weeks from its first rumblings, museum workers were engulfed in disorientation, navigating an unclear field of conflicting directives, unknown risks, uncertain timeframes, and invisible guideposts. At first one by one, then in swaths, museums began to shutter—but where? How many? For how long? And what was happening to staff and programs? There was a dearth of comprehensive information. We lacked the situational awareness needed to act with intention and strategy. Never has the essential role of evaluation been more evident.
As the fog dissipated, it became clear that closures would not be short-term and that most museum budgets would be unable to carry the same staffing levels as they had before the disease spread throughout the US. After losing my own job to a COVID closure on March 13, I joined an informal network collaborating to identify strategies for institutional survival. As we sought to benchmark what peer organizations were doing, and found only spotty information, I turned to a tool increasingly used by grassroots organizers: the online crowd-sourced spreadsheet.
The lineage of Google Sheets as collaborative data-gathering tools dates at least as far back as the #MeToo exposures of 2017, and extends right up to tabulations of police violence in Spring 2020. Thanks to an open structure—which allows unlimited collaborators 24/7 access on any operating system and anonymous contribution—they’ve been called “a familiar way station on the road to collective political action” and “the social media of the resistance.” These data dumps have played dramatic roles in the public sphere and are proving no less important in our own field.
Following the precedents of museum activism spreadsheets like Arts + All Museums Salary Transparency 2019, Indebted Cultural Workers’ Calculate Your Salary spreadsheet, and MASS Action’s Accountability Spreadsheet, I created a new sheet: Museum Staff Impact of COVID-19. In its earliest days, the sheet grew hourly, day and night, with updates of people fired, laid off, or furloughed from closed museums. In the absence of any other single source of comprehensive data on COVID’s impact on the field, journalists began citing the sheet in their work.
Experienced evaluators can readily identify these spreadsheets as imperfect. Anonymous, user-contributed data is only as accurate and complete as the knowledge of the person who enters it. Bias, from various points of view, plays a role in ways of counting, qualitative notes and the design of the sheets themselves. Cross-tabulation is nearly impossible—meaning we can’t, say, sort out the effects of geography or work experience or museum type on salaries, or make connections between museum budget size and number of COVID furloughs. The data is messy and inconsistent, often incomplete or estimated. To all that, we say “Yes.” These spreadsheets don’t offer us high confidence in accuracy. They’re not an ideal way to collect data. But in the fog of war, they are necessary to developing situational awareness.
These efforts are best seen as indicators of the need for further, deeper research. Each new sheet highlights an area of concern and offers new evidence of patterns and problems. Their creators are working to offer early evidence that may lead toward the more robust insights museum professionals need to develop budgets; solicit funding through grants, federal subsidies, and individual philanthropy; serve their communities; increase equity; or plan their careers. They hold space where not enough formal evaluation with the imprimatur of a leading organization has yet to be done.
The COVID-19 sheet, for example, has revealed patterns not clearly visible elsewhere. It was because of its user-contributed data that we were able, early on, to perceive the disproportionate loss of jobs in education and front-of-house functions as opposed to back-of-house and administrative roles, a finding that implies a potentially disproportionate loss of people of color who are more likely to work in those roles. We were also able to affirm the effects of PPP loans in stanching some of the bleeding, permitting a long hiatus between the first wave of reductions (March and April) and the second wave (beginning at the end of June). Finally, we were able to identify and share best practices in crisis management, such as deploying rolling furloughs, wage and hiring freezes, and salary reductions to help preserve jobs and continue delivering services.
This stopgap method, focused closely on impact to museum employment, worked alongside the excellent evaluation work initiated by AAM and other advocacy entities. Partnering with AAM, Wilkening Consulting connected directly with museum audiences about their responses to COVID-19. Some of that data, along with research from LaPlaca Cohen and SloverLinett, also informed a special edition of Culture Track, Culture and Community in a Time of Crisis. Americans for the Arts developed a tool for tracking ongoing economic impact of COVID in the arts and culture sector. And in July, AAM released the results of a study performed by Benchmarking Dynamics, including the warning that “without near-term assistance from governments and private donors, hundreds of directors reported their museums may not survive the financial crisis brought on by the pandemic.”
All of these efforts are vital—but they are not enough. To perform at our best, make good decisions, solicit funding, and position our museums to survive this crisis, we need the kind of robust data and sophisticated insights already taken for granted in parallel industries. We need more thorough audience data. We need more internal data about the nature, function, and composition of the museum field, and more comparative data that allows us to observe and learn from different institutional models. Without acting on real insights, we risk making poor strategic choices. An informal poll of directors and consultants resulted in the following list of needs:
- Additional audience insights and message testing on the Benchmarking Dynamics data: The prediction that one-third of museums could dissolve startled many people, inside and outside of the field. How do museum leaders best characterize these findings for local audiences and donors? How do we build on this messaging to increase all forms of support? And, with the public increasingly aware that many museums carry legacies of white supremacy, colonialism, patriarchy, gentrification, and irrelevance to their communities, do we know if financially struggling museums will engender empathy?
- Quantifying employment loss with greater precision: By all indications, the Staffing Impact Google Sheet dramatically undercounts the number of museums that have made cuts to employment. How will we quantify the true impact, more precisely and empirically? If museums do close, how will we track that result? How will we quantify museums that simply go dormant, or shift their purpose? How will we measure budget shrinkage?
- Quantifying and characterizing changes to the workforce: As thousands of museum jobs vanish, employment in our sector is changing, perhaps permanently. We need to understand whether the lost jobs have changed the demographic makeup of our workforce, so that we can meaningfully track the effects of COVID on the diversity of our field. We should ask what types of employees have been lost by length of time in the field, education level, and wage level, to determine how the crisis has changed the field’s structure and leadership pipelines. And we should look at the variable impact on different museum subspecialties, so that we can think about what changes like the widespread loss of education and public engagement staff will mean for audience services.
- Fundraising during the pandemic: As directors and boards work to rebuild budget expectations, they are asking: what fundraising strategies are working now? How are museums making up the loss of earned revenue? What is the funding pool available from public agencies and foundations, and what is the degree of competition in the applicant pool? Are individual donors stepping up more, and if so, who, and how are they giving? Are foundations changing their giving patterns or restrictions? How are museums initiating dialogue with the philanthropy community about multi-year operational funding, race equity, and more transparent dialogue about needs?
- Business model comparatives: Many museums are finding that their old revenue model will no longer sustain their operation, and better data can help them identify possible alternative sources of support. When we break museum funding down into its major categories (government sources, earned revenue, philanthropy, investments), what are the major patterns? How has COVID-19 shifted this mix? Are museums moving to less dependence on earned revenue, changing their operating hours or pricing, adjusting programming, prioritizing fee-for-service programming? How many museums are drawing on endowments to a greater extent? What are the ideal mixes for maximum flexibility and crisis survival?
- Professional development and training: COVID-19 will most certainly mean reduced travel to professional conferences and training program. What alternative models exist to facilitate the delivery of needed professional development? Will we see an expansion of digital education and remote learning options? How will this change progress and inclusion throughout the field?
- Metrics on virtual programming: Almost all museums, to some extent, pivoted to virtual and remote program delivery during spring 2020. What have we learned? How can we evaluate the success of the field in delivering remote learning and virtual engagement? What are the most promising models? Is it all about the internet, or are analog strategies more effective? Can we put together participation statistics, compare examples, and develop adaptable insights?
- Internal policies and procedures: How has COVID-19 prompted changes in internal practices, such as work-from-home policies, childcare at work, performance management, and job design? How will these changes shift best practices for assessment and accreditation?
- Compensation: In addition to the ongoing need for clear and crisp comparative salary data, we also need benchmarks from adjacent fields. How competitive are museums with other nonprofit and cultural organization salaries? How do we assign relative values to functions that are transferable vs. ones that are unique to museums?
- Qualitative data on work experience: We need detail on the experiences of staff members in their workplaces and across their museum careers. In addition to demographic data, personal narratives about exclusion, discrimination, and harassment as they are found in the museum field can help create case studies, snapshots, and detailed reports from which we can build a healthier, more welcoming field. Individual narratives help render abstract problems more concrete and visible, sparking the empathy and compassion needed to make change.
As we reposition ourselves to move through a years-long COVID transition, we call upon AAM to commit to a comprehensive, ongoing research agenda that tabulates the force of COVID in reshaping our field and offers regular insights and analysis for ongoing management. In this challenging and competitive environment, we can no longer afford to make decisions on gut instinct, ad hoc databases, or anecdotal experiences. A new era has emerged, and we need our professional organizations to help us step out of the fog.
Thanks to the many professionals from AAM member organizations across the nation who contributed evaluation needs and ideas to this post.
About the author:
Michelle Moon is a leader in museum education and an independent consultant recognized for her work on the intersection of museums and civic issues at historic sites and interdisciplinary museums including the Tenement Museum (NYC); the Peabody Essex Museum (Salem, MA), and Mystic Seaport (Mystic, CT). She is the author of Interpreting Food at Museums and Historic Sites (Rowman & Littlefield, 2015) and (with Cathy Stanton) Public History and the Food Movement: Adding the Missing Ingredient (Routledge, 2017).
Upcoming Events
-
-
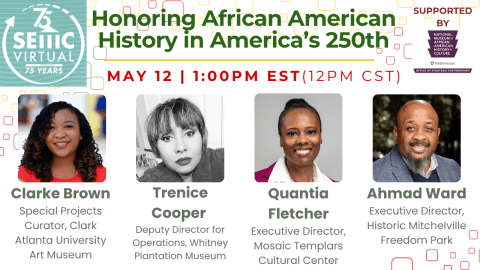
Honoring African American History in America’s 250th
Event Date:Presented by: Southeastern Museums Conference -
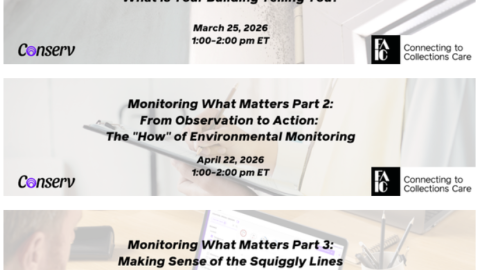
Environmental Monitoring for Collections of All Sizes
Event Date:Presented by: C2C Care/FAIC -


Thanks for sharing this, Michelle! Since May, we at RK&A (https://rka-learnwithus.com/) have been working with the Museum Education division of the National Art Education Association to launch a survey about the impacts of COVID on art museum educators. We wanted to help our art museum educator colleagues, and fortunately/unfortunately were experiencing a slowdown in our own work but had received PPP funding. We proposed some pro-bono assistance to the NAEA Museum Education division, having worked with them in the past and being particularly concerned about the predicted layoffs in education. The survey morphed over time and became very focused in on quantifying and characterizing changes to the workforce. The data will include data points so we can cross tabulate responses by regions, museum size, etc. It also touches on internal policies (e.g., did the museum provide you equipment to work remote, etc.) and qualitative effect on work (e,g., open-ended questions such as what are you most proud about your work during the pandemic?). Ultimately, we hope the results can complement the work individuals like you are doing with crowd-sourced Google sheets. I must admit, I personally had a lot of concern about launching a survey—worried about survey fatigue at a time when folks are already overwhelmed, response rate, etc. !) But as your post calls for, we really want to be able to contribute some robust data museum educators can use.
That said, if any art museum educators are reading this, please complete the survey which is being unrolled over the next couple weeks: https://www.surveymonkey.com/r/NAEAMuseEdCOVID To be eligible, you must have been employed (any level of employment) by an art museum when museums closed to the public due to the pandemic around March 13, depending on your location. If anyone has questions about the survey, please contact me Amanda Krantz at krantz@rka-learnwithus.com or Stephanie Downey at downey@rka-learnwithus.com
I do consider this survey a complement to work like what you are doing. You note some limitations to Google Sheets, but there are limitations to everything, and a survey is no different. Response rate is our biggest concern. One way to combat that is to allow participants to see responses immediately, and this is our first time using that feature in Survey Monkey. It is a little clunkier in terms of transparency than a Google Sheet. However, it has also allowed us to encourage those who might have concerns about posting their museum information in such a public format, because while we ask such questions for analysis purpose, only us as the researchers can see that more identifiable information (e.g., qualitative data is not shared immediately with participants like the quantitative data is).
Thanks again for your insight!
Amanda – thank you so much sharing the work that you and RK&A are doing! It is great to hear that the NAEA and RK&A are taking on this work. It is a part of what Michelle has been doing and a perfect example of how her call to action can spur more thought, resources and, hopefully, action to address the state of employment in our field.