When designing exhibitions, museums try to create experiences that expand visitors’ awareness of their social context, providing new information to broaden or shift their perspective. To do so, we have to understand where they’re coming from; we want to answer visitors’ questions, not tell them things they already know.
When it comes to highly polarized issues, knowing our audience is even more important—but also more difficult. We know what prominent voices say about a topic, but what do people think about it? And what are their second-order beliefs—that is, what do people believe that everyone else thinks?
Climate change is an example of a polarized issue where audience perspective really matters. Action to mitigate the effects of climate change is limited by a general tendency to underestimate society-wide concern about the problem, a phenomenon known as pluralistic ignorance. Despite the greater than 99-percent consensus among climate scientists worldwide regarding anthropogenic climate change and 66–80 percent of Americans supporting major climate change mitigation policies, Americans believe that only 37–43 percent of their peers support such policies. This difference between the perceived lack of consensus and actual support is an example of a perception gap.
In the case of climate change, the perception gap contributes to a societal inertia that limits the effectiveness of education regarding planetary health. People have access to information about climate change, but they may be less motivated to act toward solving it because they feel that they’re in the minority.

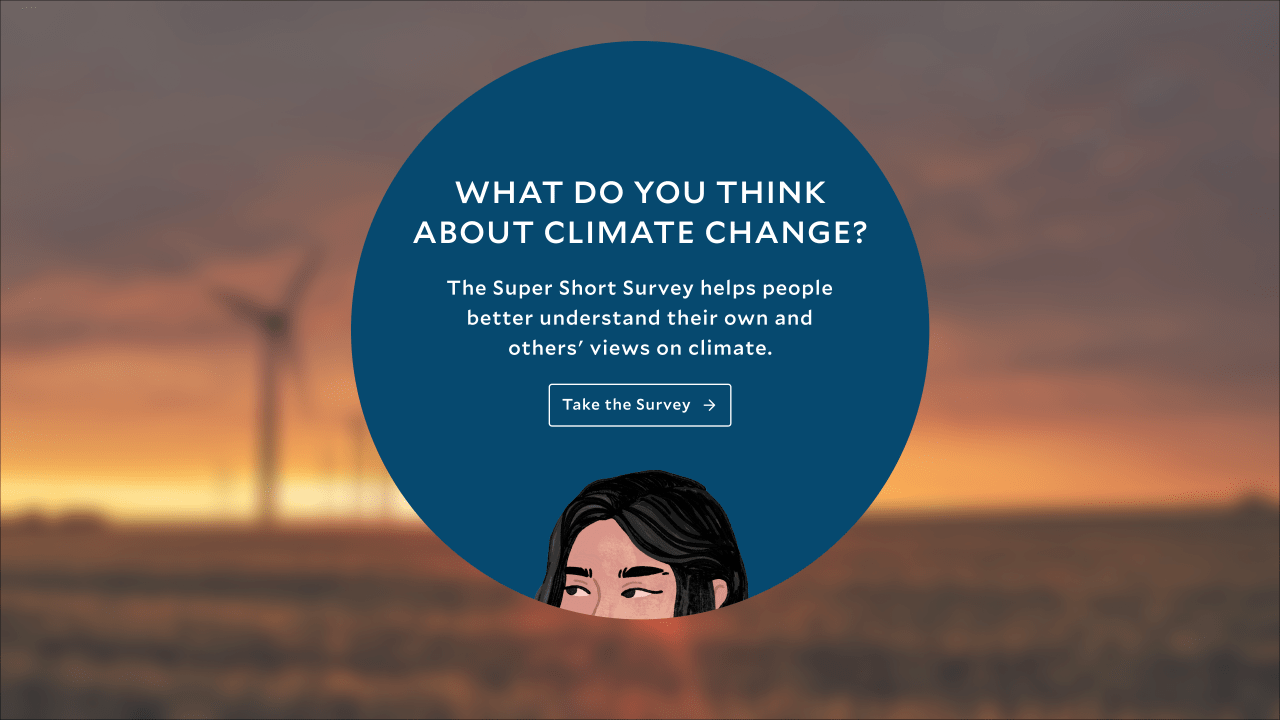
When Sitara Systems started designing an interactive exhibit about climate change for the Yale Peabody Museum, we learned a whole lot, really fast, about the field of climate change communications, with help from the Yale Program on Climate Change Communications (YPCCC). For years YPCCC has collected data about society-wide attitudes toward climate change using a tool called the Six Americas Super Short Survey (SASSY). The SASSY sorts respondents into one of six categories: Dismissive, Doubtful, Disengaged, Cautious, Concerned, or Alarmed. As of 2023, 57 percent of Americans had registered as either concerned or alarmed, and exhibit designers at the Wild Center have found even higher proportions in those top two tiers.
A visitor who is already worried about climate change doesn’t need more data about it; instead, they want to know what they can do about it.
We want to provide answers to that question; more generally and urgently, we want to inspire action toward mitigating climate change. To do so, we have to overcome the chilling effect of the perception gap. If we can collapse the perception gap, maybe we can drive more dramatic change.
So…can we close the gap?
From Paleoclimate to Present Day
The exhibit we designed is situated in the Peabody’s World of Change gallery. To connect the interactive kiosk to its surroundings, we had to create a conceptual bridge from ancient life to anthropogenic climate change.

Our entry point is paleoclimate and the effects of climate fluctuations on lifeforms throughout history. Then the exhibit moves to the present day, discussing how heat and heavy storms affect New Haven, Connecticut, where the museum is located. Each phenomenon—including urban heat islands, invasive species, and power grid stresses from increased electricity usage—is paired with an advocacy group looking to address it.
Starting there, we incorporated the four-question SASSY, building on YPCCC’s work. In addition to the SASSY, our survey included two new questions:
1. What percentage of people in our local community do you think are worried about global warming?
2. How willing or unwilling would you be to join a campaign to convince elected officials to take action to reduce global warming?
Since SASSY already had survey results for New Haven County, we realized we could incorporate those into our interactive to tell visitors about the perception gap as part of the survey. Furthermore, by running different arrangements of the survey questions and the results data, we could see how awareness of the perception gap affected visitors’ survey answers. We could even monitor actual action: after completing the survey, the visitor had the opportunity to learn more by scanning QR codes that led to the websites of the mentioned climate advocacy groups. Our implementation of the interactive let us follow how different versions of the survey track with the QR code scans.
Phase 1: Statistical Significance!
Our first round of data collection from January to August 2025 assessed how visitors’ responses changed depending on when they were informed of the perception gap during the experience. Group 1 users learned about the perception gap before estimating their willingness to engage in advocacy, while Group 2 did so after.

First, we found some differences in the SASSY results. Mainly, the Yale Peabody Museum’s visitors were more alarmed or concerned about climate change than the general population (81 percent for the museum versus 54 percent nationally—similar to the Wild Center’s findings), and zero visitors registered as disengaged (0 percent for the museum versus 5 percent nationally). This makes sense to us—the experience self-selects for respondents with existing concerns.

For our two added questions about the perception gap and climate advocacy, the results were even more interesting. Although the two groups had a statistically similar self-reported likelihood of engagement, Group 1 was more than 2.5 times more likely than Group 2 to actually scan the offered QR codes.

That’s a lot!
While some of us at Sitara have science backgrounds, this is our first venture into behavioral science research. But we know that a 2.5-times increase is statistically significant.
Are We Asking the Right Questions?
Although the data is both significant and really interesting, it doesn’t provide a conclusive answer to our question. Groups 1 and 2 were both made aware of the perception gap before they received the QR codes, so we lacked a control group. Was learning about the perception gap actually what caused the change in behavior?
What do we need to do to find out?

Next Steps
Beginning in mid-August 2025, we started a new phase of data collection with a different survey arrangement. We did this to assemble a control group of respondents who aren’t informed of the perception gap at any point in the experience.
Of course, visitors come to the exhibit with existing assumptions—20 percent of our Phase 1 respondents accurately estimated public support for climate change mitigation efforts at 50–75 percent. And if we keep talking about this, it might gain traction—which is what we want! We’d like to close the perception gap entirely, correcting for decades of polarized coverage and simplifying communication in the process.
Our goal is to better understand how design can impact communication and facilitate action. We’re not alone in this emerging design research in planetary health—the Natural History Museum of Utah, Oregon Museum of Science and Industry, and the aforementioned Wild Center are all using audience segmentation feedback to create exhibits that emphasize real solutions for achieving climate resilience. We hope to help advance the whole field by improving engagement and communication with the public.
If you have any insights into our results, we’d love to discuss them with you! We’re going to continue investigating this topic, and we want to connect with more investigators. We know there’s a lot to learn!

Upcoming Events
-
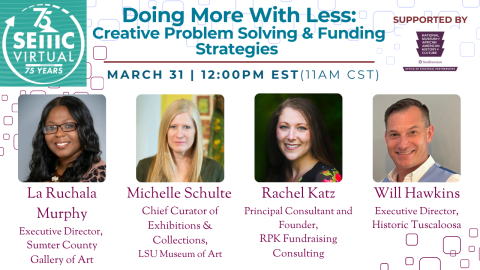
Doing More with Less: Creative Problem Solving & Funding Strategies
Event Date:Presented by: Southeastern Museums Conference -
Outdoor History Walking Tours 101
Event Date:Presented by: American Association for State and Local History (AASLH) -
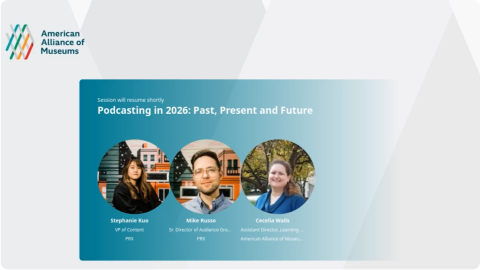
I’m In Charge of A Museum Store. Now What?
Event Date:Presented by: American Alliance of Museums -
Gettin’ To Know You: The Art of Networking
Event Date:Presented by: American Alliance of Museums


Broaden visitor’s perspective via education and facts is good. Framing the work as attempting to “shift” a visitor’s perspective seems one-sided and therefore perceived as possibly not factual. Most visitors are looking for a positive and objective experience at their chosen museum, not the programming of visitors to the Museum’s viewpoint.