
This article originally appeared in the January/February 2015 edition of the Museum magazine.
In the following article are some brief excerpts from the 2014 National Comparative Museum Salary Survey, released this past fall. Created to support decision making by museum directors and human resource professionals, the survey compiles data from 962 institutions. Included is information about benefits and part-time employees, as well as some observations on post-2008 employment patterns. Elizabeth Merritt, founding director of AAM’s Center for the Future of Museums, offers some thoughts here about the survey:
I’m pleased to share the news that the Alliance, in collaboration with all six regional museum associations, has published the first field-wide museum salary survey. Massive thanks to the staff and volunteer leadership of the Association of Midwest Museums, Mid-Atlantic Association of Museums, Mountain-Plains Museums Association, New England Museum Association, Southeastern Museums Conference and Western Museums Association for working with AAM to make this possible. It includes information on salary, benefits and demographic information for 51 positions, in many cases broken out by geographic area, museum discipline, governance and operating budget.
The salary publication is now available in the AAM bookstore online (aam-us.org/resources/bookstore). It’s being provided free to all the museums that completed all or part of the survey and at a discount to members of the regional associations or the Alliance.
I anticipate this data will primarily be used by museums to benchmark salary ranges, and by people working in museums to inform their own negotiations regarding compensation. I hope it will be used by people contemplating a career in museums to help with their financial planning and to set realistic goals. As a rule of thumb, student debt loan payments shouldn’t exceed 15 percent of a graduate’s expected starting salary. So when a would-be museum educator contemplates a degree in museum studies, it would be relevant to note that his or her starting salary is likely to be in the mid-to-high 30,000s. (That would mean a debt of no more than $5,000 or so—when average student debt on graduation from college now exceeds $30K.)
I’ve been writing lately on the CFM Blog about the economics of museum pay, including the forces that drive salaries down (while suppressing diversity of our field) and lead many staff to feel under-compensated for their work. I’ve suggested that one way to avoid this resentment is helping museums and prospective employees agree on a given job’s fair market value: the compensation (cash + intangibles) an employer and a job applicant agree on when both parties are knowledgeable, willing and unpressured. While many factors create a shared understanding of all those factors, one important piece is sound data on what people in comparable positions typically earn. With this information available, a curator’s decision to trade off $18K of salary in order to work in a rural museum rather than an urban institution is less likely to rankle later on.
I also hope this publication will provoke reflection within the field as a whole. Financials often tell the truth more clearly than obfuscating words. What social and economic factors drive the gender imbalance in museum pay and status? While two-thirds of the professionals represented in this survey are women, there are more men than women serving as directors in museums with budgets over $3M, and female directors earn only 71 cents for every dollar earned by male directors. True, this disparity reflects the pay gap in the American workplace as a whole, but does that make it acceptable? What are the biases, conscious or unconscious, acting on women’s museum careers that lead to this result, and how can we create systems and policies that eliminate such inequity?
There is great information collected in this publication. As I watched the salary project evolve, I compiled a future research wish list of additional information it would be great to have. Spurred, no doubt, by the social value theme of this year’s annual meeting, I find myself wondering: What is the ratio of highest to lowest salaries in museums, especially in the very biggest organizations? How many museums pay a living wage to their lowest-paid workers (relative to the local cost of living)? Have any museums committed to paying a living wage? You may have items to add to that list. What additional data would be useful to you, your museum or to the field? I look forward to hearing your thoughts in comments and discussions on Museum Junction and the CFM Blog. —Elizabeth Merritt
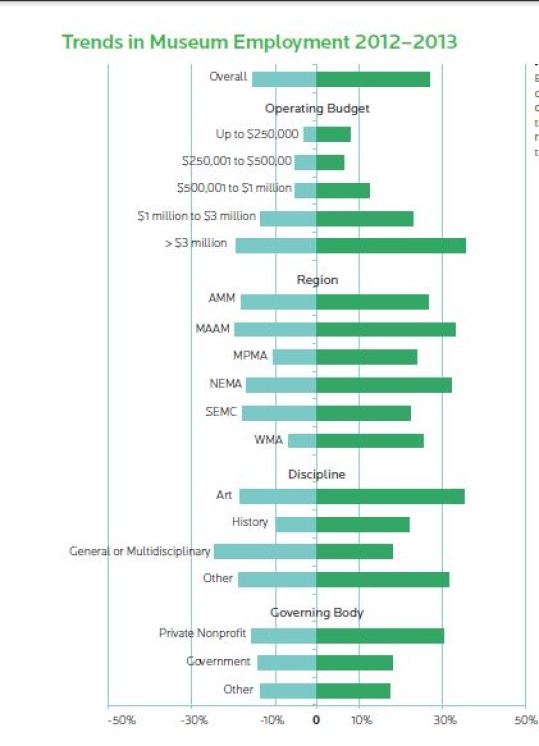
Trends in Museum Employment
The graph at left is based on responses from over 700 museums that provided information about total staff size for 2012 and 2013. The survey asked whether the museums experienced an overall increase or decrease in staffing, defined for this question as “full-time regular employees (or FTEs).” Each bar shows the percentage of museums that experienced an increase in staffing (the number on the right) or a decrease in staffing (the number on the left). The difference between the total of these two figures and 100% is the percentage of museums without a change in staffing.
In the 2012 National Comparative Museum Salary Study, significantly more museums saw their staff size decline than grow between2008 and 2010. This year, when asked to share change in staffing from the end of 2012 to 2013, more museums increased than decreased staff; however, the majority of museums maintained the same staff size. The largest museums by budget size did the best job of increasing staff levels: 35.5% of museums with operating budgets above $3 million experienced a net increase in staffing, as opposed to 7.8% of museums with operating budgets of $250,000 or below. Regionally museums in the WMA were least likely to face a decline in staffing (6.9%), while MAAM was the most likely to experience net increases in staff (33%). Art Museums reported the greatest net growth (35.2%), followed by Other (31.4%), Historic (22%) and lastly General or Multidisciplinary (18%). General or
Multidisciplinary Museums were the only category within the survey that experienced greater net loss (24.6%) than growth (18%). The same pattern was seen in the 2012 survey and suggests that General or Multidisciplinary Museums may have found it more difficult to acquire funding post-economic crisis than other types of museums. Private nonprofit museums showed the greatest growth in staff size (30.4%) among Museum Types, while Government and Other exhibited comparable levels of growth (17.9% and 17.3% respectively).
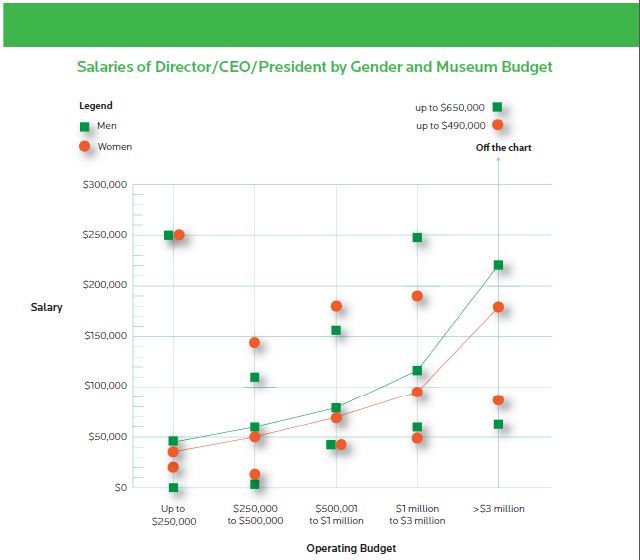
Salaries of Director/CEO/President by Gender and Museum Budget
In museums with operating budgets up to $250K, women outnumber men 2 to 1 in director positions. The disparity decreases with budget size, and at museums with budgets at or above $1M, the ratio flips and men start to outnumber women. At museums with budgets over $3M, the ratio of female to male directors is 1 to 1.3. The fact that women directors are more common in small museums may explain some of the pay disparity as well. Women directors earn 71 cents for every dollar earned by male directors, as calculated from the medians in this survey. The comparable wage gap nationally is 82 cents to the dollar (national data taken from the Institute for Women’s Policy Research report The Gender Wage Gap: 2013).
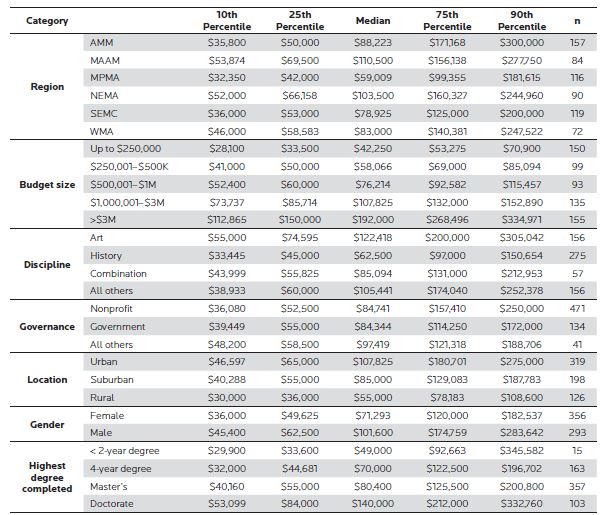
Director/CEO/President
Provides institutional leadership; reports to and works with the board; plans, organizes and directs museum activities; is responsible for policy making and funding; directs personnel and financial management; is responsible for professional practices. Typical qualifications: advanced degree in academic or related field; significant administrative experience. Additional qualifications and specific duties vary widely. In this table, “n” refers to the number of original reponses to the survey.

the WMA (39 positions), and lowest in the MPMA (44 positions) and SEMC (42 positions). In this table, “n” refers to the number of
original responses to the survey.
Demographics at a Glance
The table below offers a demographic snapshot of museum professionals, with information about gender, age and academic credentials. The sample is limited to full-time workers for whom the participating museums also provided salary information. The demographic information provided was not always complete. For this reason, we have included sampled sizes (“n”) for every data point. As always, larger samples sizes are more likely to provide an accurate reflection of the field.
Two-thirds of all full-time paid museum professionals in the 2012 survey were women, which is consistent with the results of this year’s survey (n = 3,914). Women outnumbered men in 41 of the 52 full-time positions, ranging from 91.2% of people serving as Administrative Assistant to Director or Department/Division Head to 54.5% classified as Conservator A. Men significantly outnumbered women in just a few areas of museum practice, including IT, exhibit installation, facilities and security. Very few positions demonstrated gender balance; the closest were Imaging Manager, Head of Imaging/ Visual Services and Web Manager.
The average age of all museum professionals (including full time, part time and volunteers) in the sample was 41 years. In this table, “n” refers to the number of original responses to the survey.


Upcoming Events
-
What It’s Like to Participate in Museums Advocacy Day
Event Date:Presented by: American Alliance of Museums -
From Idea to Acceptance: How to Submit a Winning Annual Meeting Session Proposal
Event Date:Presented by: American Alliance of Museums -
-
Climate Change Education Virtual Summit
Event Date:Presented by: American Public Gardens Association & the United States Botanic Garden