
This visual Data Story is based on findings from the 2023 Annual Survey of Museum-Goers, a national survey of American museum visitors from AAM and Wilkening Consulting. Every year, the survey partners with individual museums to research their audiences and yield insights about their behaviors and preferences, both on an institutional and national level. Interested in joining the 2024 edition on the themes of repeat visitation, imagination, and hope for the future? Sign up by February 28, 2024, for a special early bird rate.
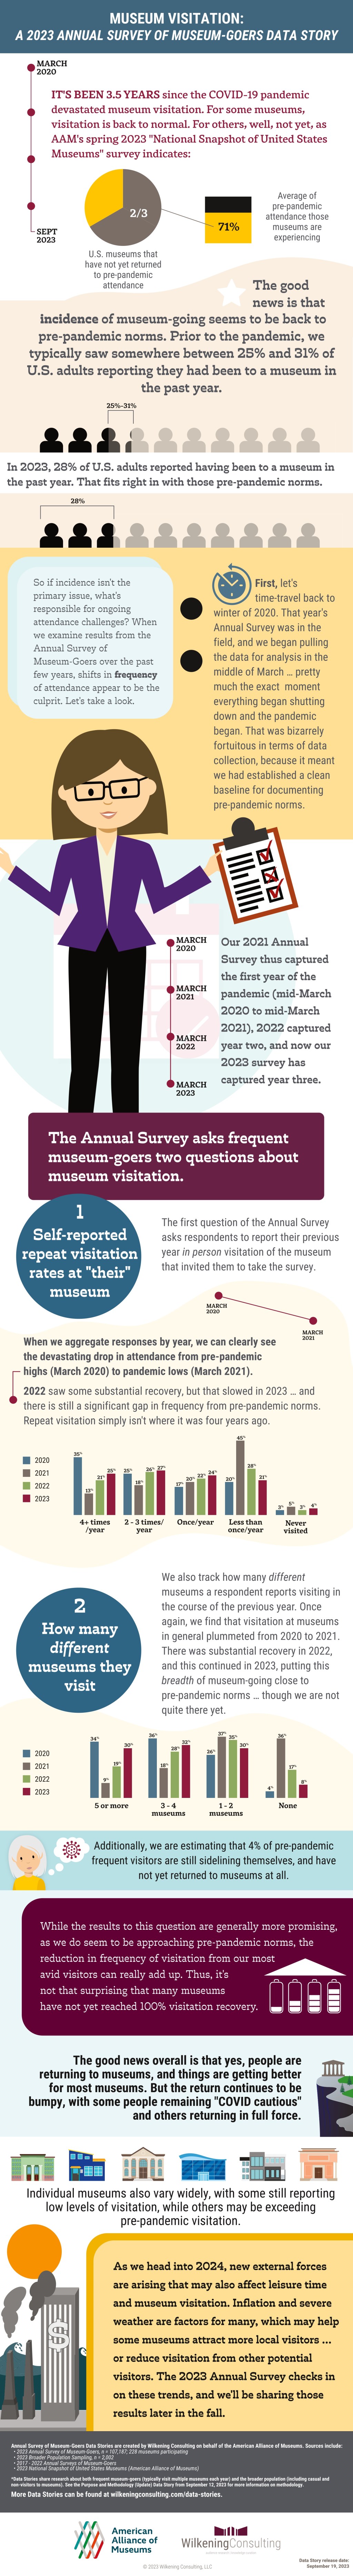
It’s been 3.5 years since the COVID-19 pandemic devastated museum visitation. For some museums, visitation is back to normal. For others, well, not yet, as AAM’s spring 2023 “National Snapshot of United States Museums” survey indicates:
- 2/3 of U.S. museums have not yet returned to pre-pandemic attendance.
- Museums are experiencing an average of 71% of pre-pandemic attendance.
The good news is that incidence of museum-going seems to be back to pre-pandemic norms. Prior to the pandemic, we typically saw somewhere between 25% and 31% of U.S. adults reporting they had been to a museum in the past year.
In 2023, 28% of U.S. adults reported having been to a museum in the past year. That fits right in with those pre-pandemic norms.
So if incidence isn’t the primary issue, what’s responsible for ongoing attendance challenges? When we examine results from the Annual Survey of Museum-Goers over the past few years, shifts in frequency of attendance appear to be the culprit. Let’s take a look.
First, let’s time-travel back to winter of 2020. That year’s Annual Survey was in the field, and we began pulling the data for analysis in the middle of March … pretty much the exact moment everything began shutting down and the pandemic began. That was bizarrely fortuitous in terms of data collection, because it meant we had established a clean baseline for documenting pre-pandemic norms.
Our 2021 Annual Survey thus captured the first year of the pandemic (mid-March 2020 to mid-March 2021), 2022 captured year two, and now our 2023 survey has captured year three.
The Annual Survey asks frequent museum-goers two questions about museum visitation.
1. Self-reported repeat visitation rates at “their” museum.
The first question of the Annual Survey asks respondents to report their previous year in person visitation of the museum that invited them to take the survey.
When we aggregate responses by year, we can clearly see the devastating drop in attendance from pre-pandemic highs (March 2020) to pandemic lows (March 2021). 2022 saw some substantial recovery, but that slowed in 2023 … and there is still a significant gap in frequency from pre-pandemic norms. Repeat visitation simply isn’t where it was four years ago.

2. How many different museums they visit.
We also track how many different museums a respondent reports visiting in the course of the previous year. Once again, we find that visitation at museums in general plummeted from 2020 to 2021. There was substantial recovery in 2022, and this continued in 2023, putting this breadth of museum-going close to pre-pandemic norms … though we are not quite there yet.
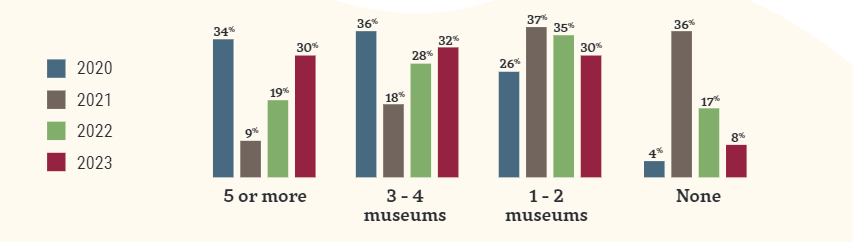
Additionally, we are estimating that 4% of pre-pandemic frequent visitors are still sidelining themselves, and have not yet returned to museums at all.
While the results to this question are generally more promising, as we do seem to be approaching pre-pandemic norms, the reduction in frequency of visitation from our most avid visitors can really add up. Thus, it’s not that surprising that many museums have not yet reached 100% visitation recovery.
The good news overall is that yes, people are returning to museums, and things are getting better for most museums. But the return continues to be bumpy, with some people remaining “COVID cautious” and others returning in full force.
Individual museums also vary widely, with some still reporting low levels of visitation, while others may be exceeding pre-pandemic visitation.
As we head into 2024, new external forces are arising that may also affect leisure time and museum visitation. Inflation and severe weather are factors for many, which may help some museums attract more local visitors … or reduce visitation from other potential visitors. The 2023 Annual Survey checks in on these trends, and we’ll be sharing those results later in the fall.
Annual Survey of Museum-Goers Data Stories are created by Wilkening Consulting on behalf of the American Alliance of Museums. Sources include:
- 2023 Annual Survey of Museum-Goers, n = 107,187; 228 museums participating
- 2023 Broader Population Sampling, n = 2,002
- 2017 – 2022 Annual Surveys of Museum-Goers
- 2023 National Snapshot of United States Museums (American Alliance of Museums)
*Data Stories share research about both frequent museum-goers (typically visit multiple museums each year) and the broader population (including casual and non-visitors to museums). See the Purpose and Methodology (Update) Data Story from September 12, 2023 for more information on methodology.
More Data Stories can be found at wilkeningconsulting.com/data-stories.

Upcoming Events
-
Planning and Budgeting for Fundraising Success – OMA Webinar
Event Date:Presented by: Ohio Museums Association -
AASLH History Hour: Civic Practice
Event Date:Presented by: American Association for State and Local History (AASLH) -
What It’s Like to Participate in Museums Advocacy Day
Event Date:Presented by: American Alliance of Museums -
From Idea to Acceptance: How to Submit a Winning Annual Meeting Session Proposal
Event Date:Presented by: American Alliance of Museums


Is the full 2023 report published somewhere?
Hi Nicole! There is no one full report from the survey, but there are several more of these data stories available that dig into visitation patterns more: https://www.aam-us.org/?s=A+2023+Annual+Survey+of+Museum-Goers+Data+Story.