Inclusive Content in Uncertain Times: A 2026 Annual Survey of Museum-Goers Data Story

Category: Alliance Blog
Graphic reading "Inclusive content in uncertain times / Inclusive attitudes continue to grow among US adults. See how attitudes have shifted in our latest Data Story."

This visual Data Story is based on findings from the 2026 Annual Survey of Museum-Goers, a national survey of American museum visitors from AAM and Wilkening Consulting. Every year, the survey partners with museums to research their audiences’ behaviors and preferences and how they compare to the broader public. (Learn more about the purpose and methodology of the survey here.) Interested in joining the 2027 edition? Sign up by December 1 to unlock a special early bird rate!


Jump to the text version


Visual version of the Data Story reproduced in text below

DEAI. It has continued to stay in the headlines for the past few years and the political discourse around the topic has remained heated.

Last year, we asked whether all that political pressure on DEAI reflects a shift in public opinion.

The short answer is still no.

The majority of US adults, and the majority of museum-goers, support and want museums to share inclusive content. This has not changed. What has changed is the political environment.

The Annual Survey of Museum-Goers has been tracking public opinions about inclusive content since 2021. We do this through a battery of three questions. Our language deliberately uses the word “inclusive,” and gives, as examples, content about “women, people of color, religious minorities, and LGBTQ+ people.”

(You can learn more about our methodology in our Data Story “The Spectrum of Inclusive Attitudes: Methodology.”)

We’ve been tracking results from two samples:

  • Frequent museum-goers (people who visit/engage with museums frequently and responded to a museum’s request to take a survey on their behalf)
  • A demographically representative sample of US adults

Since 2021, inclusive attitudes among frequent museum-goers really have not budged, though the anti-inclusive side has increased slightly.
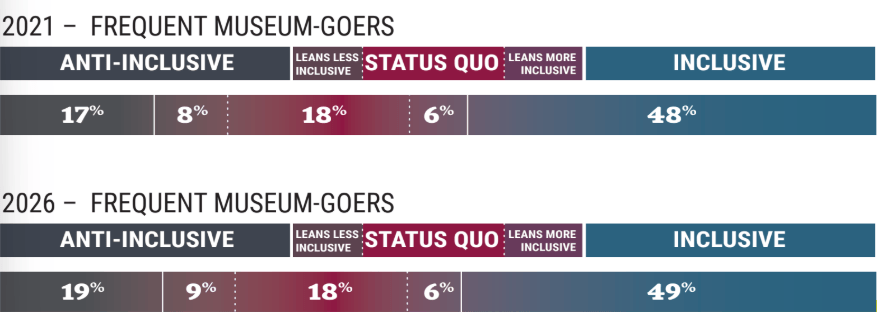
Chart 1: 2021 – Frequent Museum-Goers
 Stacked bar chart showing attitudes toward inclusivity among frequent museum-goers in 2021. Forty-eight percent are Inclusive, 6% lean more inclusive, 18% are Status Quo, 8% lean less inclusive, and 17% are Anti-Inclusive. Inclusive is the largest segment, accounting for nearly half of respondents.

Chart 2: 2026 – Frequent Museum-Goers
 Stacked bar chart showing projected attitudes toward inclusivity among frequent museum-goers in 2026. Forty-nine percent are Inclusive, 6% lean more inclusive, 18% are Status Quo, 9% lean less inclusive, and 19% are Anti-Inclusive. Distribution remains largely unchanged from 2021, with Inclusive remaining the largest segment at just under half of respondents.

Why don’t the percentages always add up to 100? Well, our numbers are estimates based off of responses to three questions, which we round to whole numbers…sometimes it adds up to 101, or 98. That’s the nature of the work!

But attitudes among our demographically-representative samples of US adults indicate a significant overall shift towards inclusion.
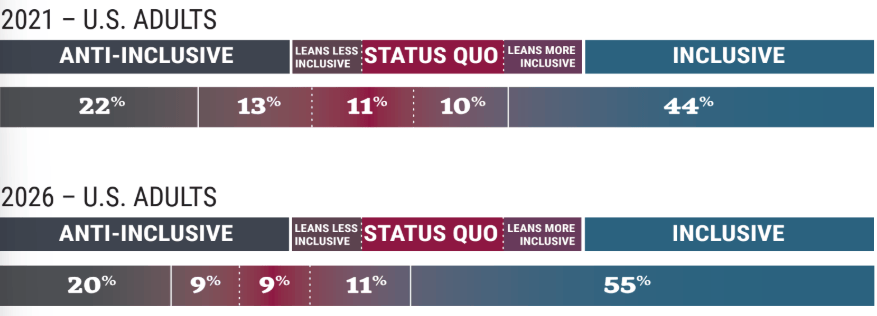
Chart 1: 2021 – U.S. Adults
 Stacked bar chart showing attitudes toward inclusivity among U.S. adults in 2021. Forty-four percent are Inclusive, 10% lean more inclusive, 11% are Status Quo, 13% lean less inclusive, and 22% are Anti-Inclusive. Inclusive is the largest segment, representing nearly half of respondents.

Chart 2: 2026 – U.S. Adults
 Stacked bar chart showing projected attitudes toward inclusivity among U.S. adults in 2026. Fifty-five percent are Inclusive, 11% lean more inclusive, 9% are Status Quo, 9% lean less inclusive, and 20% are Anti-Inclusive. Compared with 2021, the Inclusive segment increases from 44% to 55%, while Anti-Inclusive and Status Quo segments decrease.

There are definite differences when we examine US adults by age and life stage, but the majority of each segment still falls on the inclusive side of the spectrum.

Chart 1: Under 40, No Minor Children
 Stacked bar chart showing projected inclusivity attitudes among U.S. adults under age 40 without minor children in 2026. Sixty percent are Inclusive, 10% lean more inclusive, 9% are Status Quo, 7% lean less inclusive, and 16% are Anti-Inclusive. This group has one of the highest Inclusive shares.

Chart 2: Parents/Guardians of Minor Children
 Stacked bar chart showing projected inclusivity attitudes among parents or guardians of minor children in 2026. Sixty-two percent are Inclusive, 10% lean more inclusive, 8% are Status Quo, 7% lean less inclusive, and 16% are Anti-Inclusive. Inclusive attitudes are highest among the life-stage groups shown.

Chart 3: Ages 40–59, No Minor Children
 Stacked bar chart showing projected inclusivity attitudes among adults ages 40 to 59 without minor children in 2026. Fifty-two percent are Inclusive, 12% lean more inclusive, 9% are Status Quo, 9% lean less inclusive, and 20% are Anti-Inclusive. Inclusive remains the largest segment, though less pronounced than among younger adults and parents.

Chart 4: Age 60 or Older, No Minor Children
 Stacked bar chart showing projected inclusivity attitudes among adults age 60 or older without minor children in 2026. Forty-seven percent are Inclusive, 10% lean more inclusive, 9% are Status Quo, 11% lean less inclusive, and 26% are Anti-Inclusive. This group has the lowest Inclusive share and the highest Anti-Inclusive share among the segments shown.

So where is the pushback to inclusive content coming from? Well, it is, indeed, political. We can certainly see that when we compare the responses of conservatives and liberals, there are significant differences. But even then, the majority of conservatives still fall on the side of inclusion.
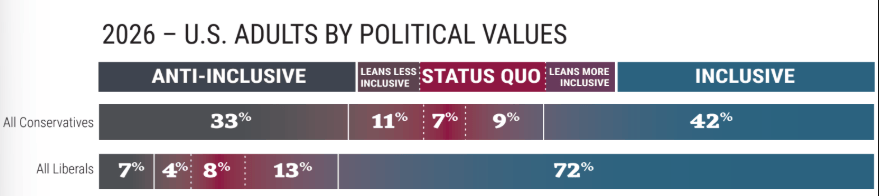
U.S. Adults by Political Values

Chart 1: All Conservatives
 Stacked bar chart showing projected inclusivity attitudes among U.S. adults who identify as conservatives in 2026. Forty-two percent are Inclusive, 9% lean more inclusive, 7% are Status Quo, 11% lean less inclusive, and 33% are Anti-Inclusive. Inclusive is the largest segment, but conservatives are more evenly divided across categories than liberals.

Chart 2: All Liberals
 Stacked bar chart showing projected inclusivity attitudes among U.S. adults who identify as liberals in 2026. Seventy-two percent are Inclusive, 13% lean more inclusive, 8% are Status Quo, 4% lean less inclusive, and 7% are Anti-Inclusive. Inclusive attitudes dominate among liberals, with nearly three-quarters falling into the Inclusive segment.

While the larger segment of anti-inclusive conservatives are likely driving anti-inclusive rhetoric and initiatives politically, it bears remembering that they don’t represent the majority of Americans, and they don’t even represent the majority of conservatives.

Most Americans, regardless of political values, support inclusive content in museums. Period.

Navigating inclusion during the immediate future has, undoubtedly, become more fraught. We don’t want to dismiss those challenges.

But neither do we want to dismiss the fact that inclusion helps all of us different perspectives and life experiences, helps us understand the world and its history more completely, and is what most people want from us.

In fact, the data indicates that the biggest risk we face is losing our credibility with the public by not telling the truth…and for most people, that requires us to be inclusive of all humanity. We’ll continue to monitor trust and credibility as part of our future sampling.

Until then, existing tools can help you navigate this period of uncertainty, including Audiences and Inclusion: A Primer for Cultivating More Inclusive Attitudes Among the Public and our Data Story “Beware! The False Consensus Effect.“


Annual Survey of Museum-Goers Data Stories are created by Wilkening Consulting on behalf of the American Alliance of Museums. Sources include:

  • 2026 Annual Survey of Museum-Goers, n = 75,742; 186 museums participating
  • 2026 Broader Population Sampling, n = 2,045
  • 2017 – 2025 Annual Surveys of Museum-Goers

*Data Stories share research about both frequent museum-goers (typically visit multiple museums each year) and the broader population (including casual, sporadic, and non-visitors to museums). See the Purpose and Methodology (2026 Update) Data Story from September 10, 2026 for more information on methodology.

Data Story release date: October 8, 2026

© 2026 Wilkening Consulting, LLC

https://wilkeningconsulting.com/data-stories/
https://wilkeningconsulting.com/methodology-2025/

AAM Member-Only Content

AAM Members get exclusive access to premium digital content including:

  • Featured articles from Museum magazine
  • Access to more than 1,500 resource listings from the Resource Center
  • Tools, reports, and templates for equipping your work in museums
Log In

We're Sorry

Your current membership level does not allow you to access this content.

Upgrade Your Membership

Leave a Reply

Your email address will not be published. Required fields are marked *

AAM Member-Only Content

AAM Members get exclusive access to premium digital content including:

  • Featured articles from Museum magazine
  • Access to more than 1,500 resource listings from the Resource Center
  • Tools, reports, and templates for equipping your work in museums
Log In

We're Sorry

Your current membership level does not allow you to access this content.

Upgrade Your Membership

Subscribe to our Newsletter!

Our weekly newsletter is packed with stories, resources, and information for museum people. Once you've completed the form below, confirm your subscription in the email sent to you.

If you are a current AAM member, please sign-up using the email address associated with your account.

Are you a museum professional?

Are you a current AAM member?

Success! Now check your email to confirm your subscription, and please add communications@aam-us.org to your safe sender list.