Last month AAM released the results of our fifth “snapshot” survey of the field. These snapshots, which started as a means of checking in on museums and museum workers during COVID shutdown, now help us track recovery and continued challenges as our sector emerges from the pandemic.
Attendance
Despite significant improvements across the board, challenges do remain. Only a third of the responding museums have entirely recovered their pre-pandemic attendance. Those that have not bounced back are, on average, experiencing only 71 percent of their 2019 attendance. Will this damage, for the most part, heal with time, or will some of these missing visitors remain lost? That probably depends, in part, on which audience segment we look at. Forty percent of respondents are still experiencing reduced general attendance. While individual museums may continue to experience challenges, there is no reason to believe that museum visitation, as a whole, is going to remain depressed. IMPACT Experience pegs their 2023 attendance projections for exhibit-based entities at 98.6 percent of 2019 attendance.
Of course, this will vary museum to museum. Some museums may experience long-term shifts in visitation due to changes in their cities’ economy and population. During the first year of the pandemic, over half of the largest cities in the US lost population, and while most have begun to rebound, some (including New York, Boston, Milwaukee, and Los Angeles) have merely stemmed the rate of loss. Some speculate that San Francisco, another city struggling to rebound, may be caught in a “doom loop” of empty office space, reduced public transit, shuttered small business, and tanking tax revenues.
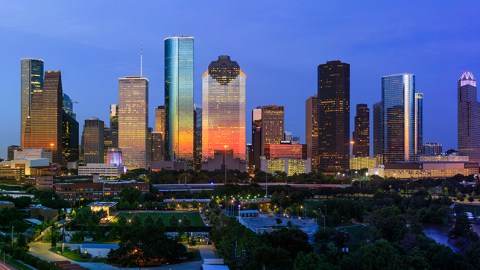
On the other hand, some cities, notably San Antonio, Phoenix, Houston, and Dallas, are growing. But the fact that eleven of the fifteen fastest-growing cities in the US are in Arizona, Texas, or Florida should be enough to give us pause. All three of those states are experiencing extreme heat this summer—a condition that is projected to happen more frequently in coming years. At what point will this migration slow and reverse, as people look for places to live that don’t have life-threatening heat, unstable electric grids, water shortages, and escalating severe weather?
Some segments of attendance may experience long-term change. Forty percent of respondents are seeing fewer students from K-12 in-person field trips. Disruptions to primary education inflicted unprecedented damage to reading and math skills, and a recent study by the Northwest Evaluation Association estimates students, on average, need more than an additional four months of instruction to catch up with these losses. As school systems struggle to make up this lost time, will school trips (already in decline for over a decade) become even rarer?
So, what are the take-aways for your own organization?
- If your attendance has not rebounded 100 percent, you are in the majority—don’t feel like this is a marker of some unique failing on your part.
- But it is worth paying attention to what segments of attendance are still lagging and dig into related data. What are the plans for your local school system regarding field trips and/or summer sessions? What are your city and region’s projections regarding in- and out-migration?
- Using that data, are there strategies your museum can devise to push back against declines? Perhaps you might offer virtual field trips that allow teachers to access museum content in more time-efficient ways. Or you might partner with local initiatives to retain and attract businesses, and residents.
Staffing
While 36 percent of museums now report they have the same staff size as in 2019, 38 percent have increased staff compared to pre-pandemic levels (with median growth of 20 percent), and one quarter (26 percent) have shrunk (with a median decrease of 20 percent).
Of those museums that are hiring, 60 percent are having trouble filling open positions. (Mirroring the national labor shortage generally, and the nonprofit labor shortage specifically.) The biggest challenges are filling guest services/admissions/frontline/retail positions (cited by 48 percent of museums that are having trouble filling open positions) and facilities/maintenance/ security (32 percent). These challenges extend to museum-specific positions as well: 39 percent of museums report difficulties filling curatorial/collections/exhibitions/publications positions, and one quarter (26 percent) are having trouble filling education positions.
As is often the case with research, this tantalizing data raises as many questions as it answers. What are the barriers to recruitment, and do these barriers differ by position type? The overarching challenge is, one presumes, the strong labor market: the US unemployment rate is currently 3.6 percent, which economists consider to be “full employment.” A recent survey by Bankrate reports that more than half of the workforce (56 percent) is likely to be looking for a new job in the next year, and for over one-third (37 percent) that is “very likely.” Taking advantage of demand for labor, many of these job seekers plan to look for higher pay, flexible work hours, and remote or hybrid work as they sort through their options.
How can your organization attract and retain the employees you need? Numerous studies suggest it can be effective to:
- Review your compensation structure, and make adjustments, if needed, in order to offer a living/fair/competitive wage for your area.
- Survey your current employees and review information collected in exit interviews to identify ways in which your work culture might be contributing to turnover. Many companies are finding that committing to transparency, good communications, and inclusive practices improves employee satisfaction.
- Provide growth and development opportunities that provide employees with pathways for advancement within the organization or in their ongoing careers.
- Create meaningful workplace recognition programs that show staff they are seen and appreciated.
- Offer flexible work arrangements that prioritize employee wellbeing and foster work-life balance for people with diverse family and personal needs.
To explore more about building a successful post-pandemic workplace, you can register for a free webinar hosted by Blackbaud on Thursday, July 27, 3-4 pm ET. I’ll be joined on the digital stage by Kara Newport, CEO of Filoli, who will discuss how that organization instituted a living wage for staff, and Executive Director Molly Giordano who will talk about nurturing a people-centered work culture at the Delaware Art Museum.
Finances
If you chart the financial recovery of museums, in the wake of the pandemic, you get a classic bell curve:
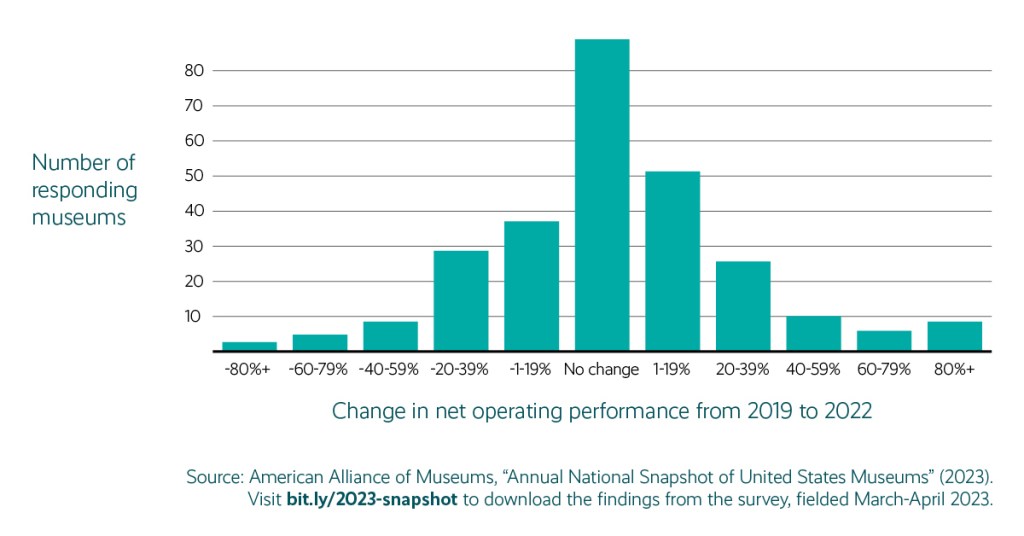
If we look at net operating performance, we see an almost an even split between museums that have recovered to their 2019 financial state (31 percent), declined (30 percent, with a net decrease in NOP of 20 percent), or improved (39 percent, with a net increase of 19 percent).
On the whole, directors seem optimistic about continued recovery: almost half (46 percent) project their bottom line will increase this year, while 38 percent project no change compared to 2022. There is a small group of troubling outliers, however. Sixteen percent of directors think their bottom line will decrease this year, by a projected median of 15 percent.
This finding demonstrates the limitations of the snapshot format. While keeping the survey instrument short increased the response rate (and therefore the robustness of the data), it leaves us with yet more questions. Why is this small but significant group of museums expecting financial decline? Is it due to changes in the local economy, shifts in philanthropy, or challenges specific to particular organizations? Are they simply lagging their peers in the timeline of recovery, or do they need additional assistance if they are to regain an even keel? Hopefully we can tease some of these answers out from other data in coming years, in part from additional surveys to the field. Which brings me to my next point.
Stand up and be heard
850 museum directors answered the snapshot survey we fielded in October 2020–this latest snapshot garnered 340 responses. (I suspect the decline is in large part due to a waning sense of urgency, as pandemic pressure eased.) You might remember from a long-ago statistics course that the size of the sample can have a tremendous effect on the precision of the resulting data. That October 2020 data had a margin of error of 3 percent. The smaller sample from the most recent snapshot widened that to over 5 percent. With the statistical parameters we use, that means that if a given data point is 85 percent, we are 95 percent sure that the “real” number (if you could precisely measure reality) falls between 80 and 90 percent. To get the margin of error down to +/- 2 percent, we would need about two thousand museums to answer a survey!
If that paragraph read as “blah blah blah…math,” consider this: the data AAM collects is incredibly important for national advocacy, including and especially advocating for funding for American museums. This latest snapshot showed how many museums relied on financial relief provide by the government—60 percent of respondents received a Payroll Protection Program loan, and of these 88 percent said that relief that relief was very important to their having survived the pandemic. (In fact, nearly a quarter said “we probably would not have survived without it.”) More and better data improves our ability to make the case for museums on the Hill.
And also this: Every time we publish data we get asked “can you run an analysis for just…” (fill in the blank with, for example, science museums, art museums with budgets between $3 and $6 million, historic house museums in New England). To run such cross-tabs (as they are called) the number of museums in that specific subset has to be large as well. To have robust data on zoos, specifically, a lot of zoos need to answer the survey!
So here’s my pitch to you: Next time you receive a survey from AAM, please carve out time from your busy schedule to fill it in and send it back. We do our best to only ask for information that is important, and actionable—things that legislators, funders, or people making decisions for museums want to know. And in return, we will offer you more and better data, and use it to make the case for museums with whoever should listen.

Upcoming Events
-
CEO Chat: Censorship
Event Date:Presented by: American Alliance of Museums -
Makerspaces for Museums and Historic Sites
Event Date:Presented by: American Association for State and Local History (AASLH) -
Planning and Budgeting for Fundraising Success – OMA Webinar
Event Date:Presented by: Ohio Museums Association -
AASLH History Hour: Civic Practice
Event Date:Presented by: American Association for State and Local History (AASLH)


Thank you for this information. It is most helpful and will be shared with the museum board members.
Very interesting. Thanks for all of this great information!
This is great info… especially someone new to this industry!