This visual Data Story is based on findings from the 2026 Annual Survey of Museum-Goers, a national survey of American museum visitors from AAM and Wilkening Consulting. Every year, the survey partners with museums to research their audiences’ behaviors and preferences and how they compare to the broader public. (Learn more about the purpose and methodology of the survey here.) Interested in joining the 2027 edition? Sign up by December 1 to unlock a special early bird rate!

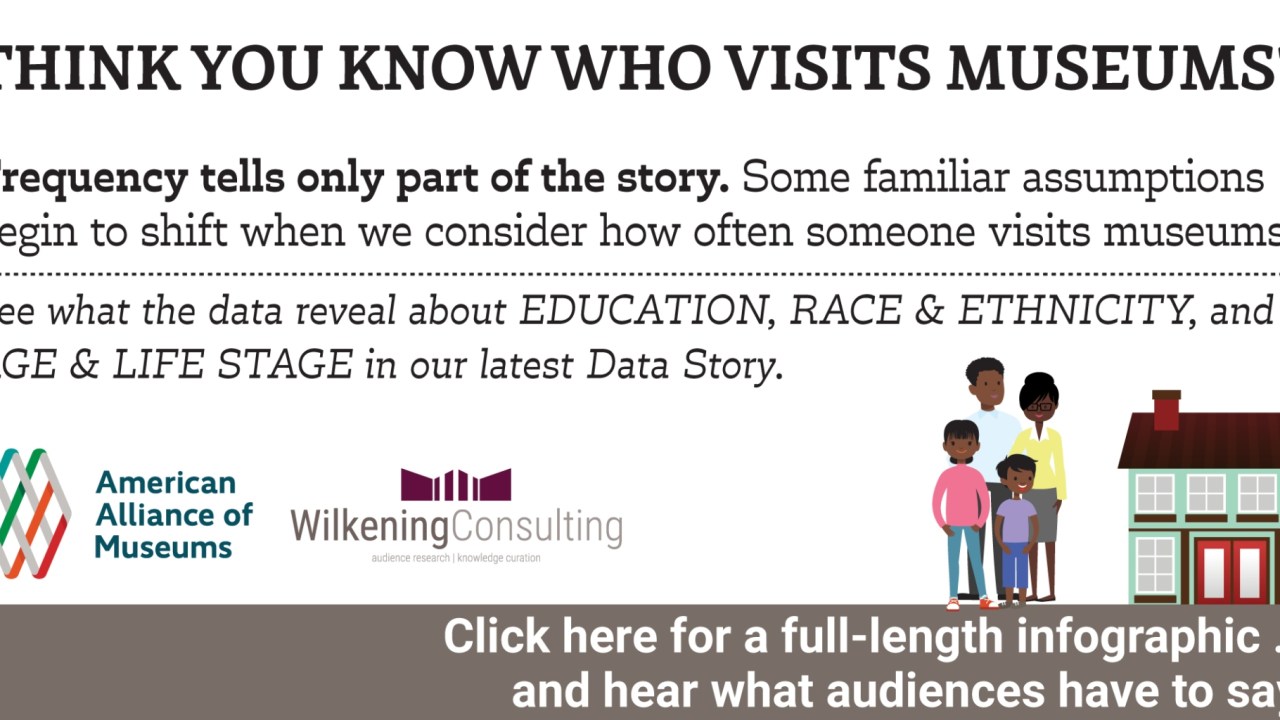
Who goes to museums? The answer depends on what we mean by goes.
Looking at frequent museum-goers alone tells us only part of the story.
When we include people who visit museums less often, many demographic gaps shrink dramatically. Some disappear altogether.
There are two big things to consider when we look at visitation gaps among the broader population: incidence and frequency.
Incidence is a binary yes/no question: has someone been to a museum (of any type) in the past year? To measure this, we field a broader population survey to gather data from a demographically representative sample of US adults.
Frequency is different. It measures how often someone has been to museums in a defined time period.
When we field the Annual Survey of Museum-Goers, the respondents are overwhelmingly frequent museum-goers.
Our simplified definition of these individuals is that they are engaged enough with one (or more) museums to be on a communications list (email, social media, etc.) and then complete a survey on a museum’s behalf. We do assess their frequency, and virtually all respondents are what we would define as frequent museum-goers.
From these two groups, we then plot out certain demographic characteristics–and find that people who visit museums regularly (frequency) can be very different from people who visit museums at all (incidence). That is, the demographic profile of frequent museum-goers is a bit different than the profile of all museum-goers, especially the more casual visitors.
Identifying where gaps exist, and where they don’t, is important because it gives us a more nuanced understanding of who museums are reaching, and how deeply.
In this Data Story, there are three demographic factors that we want to examine more completely: educational attainment, race and ethnicity, and life stage.
Educational Attainment
Among frequent museum-goers, 83% of respondents have a college or advanced degree; that’s 2.3x the rate of college or advanced degrees among all US adults age 25 years or older (36%). (1)
But when we look at our broader population sample, we see a much smaller gap. Among casual museum visitors, those who visited a museum in the past year, 52% have a college degree, and 48% do not.
It turns out a lot people without college degrees do go to museums, they are just more likely to be casual or sporadic visitors rather than frequent visitors.
Percentage of US adults in each population segment who visited a museum in the past year:
- 42% College degree
- 31% Some college/technical school/associate degree
- 20% High school diploma/GED or less
Race and Ethnicity
Among frequent museum-goers, 84% say that they (or a member of their household) identify as white. In contrast, 57% of people living in the United States identify as white (not Hispanic or Latine). (2)
But that 84% tells only part of the story. The accurate conclusion is that yes, frequent museum-goers are significantly more likely to identify as white than the broader population.
Incidence, however, tells a very different story.
In 2026, African American, Hispanic or Latine, and white respondents were about equally likely to have visited a museum in the past year. And this isn’t new — these three groups have had similar incidence for a while now. And for the fifth year in a row, Asian or Asian Americans have been the most likely racial or ethnic group to have visited a museum in the past year.
Percentage of US adults in each population segment who visited a museum in the past year:
- 33% African American or Black
- 44% Asian or Asian American
- 30% Hispanic or Latine
- 32% White (not Hispanic or Latine)
(Responses by other racial and ethnic groups were too small to be considered stable)
Looking at incidence, instead of frequency, changes the picture dramatically.
Additionally (and this has been true for the past several years), white people are the most likely to say they “never” visit museums while people of color are more likely to say they visit museums at least occasionally.
Surprised? We were too when we first saw a closing, and then erasure, of the incidence gap several years ago, and we wondered if it was a fluke. But five years of consistent data? This is a pattern.
There’s more to the story, however.
Incidence gaps do still persist by museum type and for specific museums.
By museum type, historic sites in particular have persistently high incidence and frequency gaps, with audiences still, overall, skewing disproportionately white.
Additionally, this still varies widely for individual museums. Your museum may still be facing an incidence gap, and only research specific to your museum can help you understand where your gaps are (or are not).
The frequency gap we see by race and ethnicity is incredibly persistent, but we have seen signs that this has been changing. Since 2017, the percent of frequent museum-goers identifying as white has decreased. Most of that change happened early on, and the number has held steady the last few years. We’ll continue tracking this in the years ahead…
Frequent Museum-Goers from the Annual Survey of Museum-Goers: % White Respondents Since 2017
- 2017: 92%
- 2019: 88%
- 2021: 87%
- 2023: 84%
- 2026: 84%
(From 2017 to 2025, the white (not Hispanic or Latine) population of the US decreased from 62% to 56%. [3])
Age and Life Stage
Some museum types deliberately focus on families with minor children (children’s museums and, to a lesser extent, zoos, aquaria, and science centers), and these museums don’t tend to see frequency gaps (or incidence gaps) by age that are of significant concern…though they often see frequency gaps with young adults without children.
But it is a different story for art museums, history organizations, and botanical gardens. It is incredibly common for the majority of their frequent museum-goers to be over the age of 60.
This, understandably, can cause a great deal of concern for people working in these types of museums. And that’s why looking at incidence is so important.
It turns out, adults over 60 are the least likely segment of the population to visit museums (a pattern we have seen pretty consistently over the past several years). We actually underserve them.
Percentage of US adults in each population segment who visited a museum in the past year:
- 32% Young adults (under 40, no children)
- 38% Parents/guardians of minor children
- 29% 40 – 59, no minor children
- 28% 60 or older
Additionally, those casual and sporadic young adult visitors visit most museum types, lagging behind the overall average only for children’s museums and zoos/aquaria (largely because, well, they don’t have children; this shifts when some of them start families, of course!).
The future pipeline of museum visitors appears secure in that there is a pipeline of future visitors whose life stages will shift in ways that museums can encourage greater visitation.
But this is not a sure thing. Museums have to work to maintain and grow this audience, especially when people are feeling pressured and constrained.
Unfortunately, cracks seem to be developing among our most likely audience: families.
This year’s research explores those pressures and constraints, as well as opportunities for deeper meaning-making and connection, so that museums can navigate uncertain times. We’ll be exploring all of these topics over the coming months. Stay tuned.
Annual Survey of Museum-Goers Data Stories are created by Wilkening Consulting on behalf of the American Alliance of Museums. Sources include:
- 2026 Annual Survey of Museum-Goers, n = 75,742; 186 museums participating
- 2026 Broader Population Sampling, n = 2,045
- 2017 – 2025 Annual Surveys of Museum-Goers
- U.S. Census Bureau. (n.d.). Selected Social Characteristics in the United States. American Community Survey, ACS 5-Year Estimates Data Profiles, Table DP02. Retrieved August 10, 2026, from https://data.census.gov/table/ACSDP5Y2024.DP02?y=2024&d=ACS+5-Year+Estimates+Data+Profiles.
- U.S. Census Bureau. (n.d.). ACS Demographic and Housing Estimates. American Community Survey, ACS 5-Year Estimates Data Profiles, Table DP05. Retrieved August 10, 2026, from https://data.census.gov/table/ACSDP5Y2024.DP05?y=2024&d=ACS+5-Year+Estimates+Data+Profiles.
- U.S. Census Bureau. (n.d.). QuickFacts: United States — White alone, not Hispanic or Latino, percent. Population Estimates Program, Vintage 2025 Population Estimates. Retrieved August 20, 2026, from https://www.census.gov/quickfacts/fact/table/US/RHI825224.
*Data Stories share research about both frequent museum-goers (typically visit multiple museums each year) and the broader population (including casual, sporadic, and non-visitors to museums). See the Purpose and Methodology (2026 Update) Data Story from September 10, 2026 for more information on methodology.
Data Story release date: September 17, 2026
© 2025 Wilkening Consulting, LLC
https://wilkeningconsulting.com/data-stories/
https://wilkeningconsulting.com/methodology-2025/

Upcoming Events
-
Understanding the U.S. History Sector
Event Date:Presented by: American Association for State and Local History (AASLH) -
-
-
Industry Showcase: Innovative Digital Solutions
Event Date: