Introduction to This Scenario
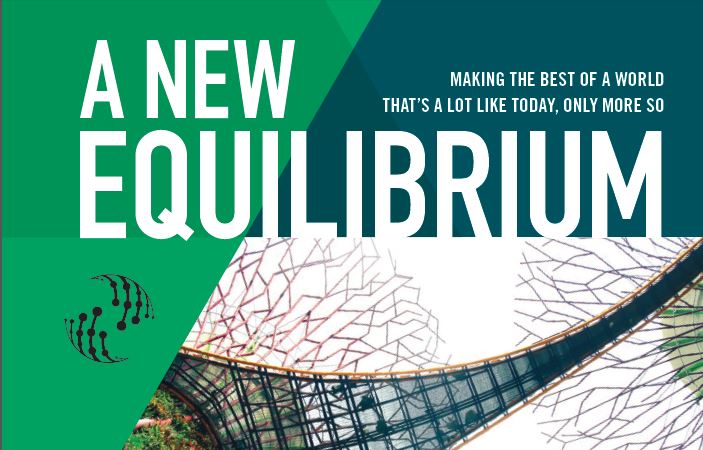
“A New Equilibrium” describes a future that might result from existing limits and challenges as they play out in coming decades. Using mainstream projections from credible sources, we envision where our current path might take us. (See Signals, below, for a selection of the research undergirding this story.)
“Equilibrium” explores a probable future, set in the center of the “Cone of Plausibility.” Scenarios inhabiting this zone of the Cone, defined by conventional expectations, generally resemble amplified versions of the present. People tend to operate with the hazy assumption that the future will lie somewhere in this zone. While probable scenarios rarely reflect ideal circumstances, they at least offer the comfort of familiarity. By surfacing, examining, and critically deconstructing the assumptions that underlie probable futures, planners can:
- Distinguish between expectations and probabilities. Things we presume will happen are not necessarily likely, and things that are very likely may hold no space in our imaginations. Many Baby Boomers’ first exposure to futurism was the 1960s cartoon The Jetsons, set in 2062. Halfway to that mark, we’re still waiting for flying cars, but the 1950s social dynamics of George’s family are already blatantly anachronistic.
- Recognize blind spots. Technology is shiny and sexy and fun to shop for. Consequentially, it often looms unduly large in our imaginings of the future. (Hence the Jetsons’ obsession with flying cars, robot maid, and food replicators.) Yes, technology will shape our world, but technology itself is shaped by cultural, economic, and environmental change. Even five years ago most architects automatically included two kinds of restrooms in plans for a new museum: men’s and women’s. Now it is more common for designers to realize they need to serve people who identify as transgender or gender neutral (or better yet, to create adaptable space that can keep pace with evolving expectations regarding restroom equity).
- Identify forces that may disrupt a straight path to the probable future. Newton’s first law of motion, as applied to forecasting, might be stated as, “Trends continue in the same speed and same direction unless acted upon by an unbalanced force.” Unbalanced forces pretty much characterize our world, but it takes thoughtful focus to identify specific disruptors and evaluate their potential effects.
- Assess whether probable is the same as preferable. A more informal wording of Newton’s first law of forecasting might be, “Absent disruptions, we’ll get where we are going.” But will we actually like that future when we arrive? Painting a picture of the expected future can motivate us to become changemakers, pushing the world towards more desirable outcomes.
A Snapshot of This Future
This synopsis provides a high-level description of the year 2040 with respect to culture, technology, the economy, ecology, and policy.
The US population is older and more diverse than it was in 2017. The Latino population has grown to compose 25 percent of the population, and within 10 years no one racial group will make up a majority of the country. The population continues to age: 22 percent of the population is over the age of 65. Advances in healthy aging have been offset by the increase in diabetes, heart disease, and related illnesses, but overall, the ratio of retired people to people of working age (so-called “old-age dependency”) has climbed to 38 percent from 25 percent in 2017. One in four Americans have never married, up from one in five in 2012.
Economic stratification has continued to grow in the past few decades. The top 10 percent of families now holds 85 percent of the wealth in the US, while the bottom 60 percent holds
1 percent. Automation and the applications of advanced artificial intelligence (AI) have displaced much human labor, including warehouse employees, cashiers, medical technicians, translators,
receptionists, security guards, and salespeople. Jobs requiring empathy and social skills, such as therapists, personal trainers, and home care attendants, have remained solid, though low-paying, and there has been a surge in demand for highly skilled labor in programming and data analytics. AI applications provide critical assistance to a wide variety of professionals, including doctors, lawyers, engineers, designers, scientists, and policy analysts, creating more effective, affordable products and services. Total labor participation stands at about 58 percent (compared to 63 percent in 2017). About 45 percent of workers are primarily employed in the so-called “gig economy,” characterized by alternative working arrangements such as on-call, temporary help, contract work, or freelance.
Consumption of complex digital content continues to rise. Immersive, multisensory virtual reality rigs are as affordable and common in 2040 as large-screen televisions were in 2017. The latest American Time Use Survey documents robust consumption of streaming content on a variety of platforms for entertainment, socializing, and gaming, but contrary to some predictions, screen time in all its forms leveled off in the early 2020s. 2020s. Demand for physical, place-based experienced IRL (In Real Life) experiences has grown in the past two decades.
Public education largely conforms to the model codified in the last century. Public schools continue to emphasize standardized testing, though a brief consensus on curricula (the “Common Core” of the early 2000s) has fragmented, and only 12 states currently participate in a shared standards initiative. There has been significant growth in the number of private schools, and charter schools now serve 15 percent of the public school population (triple the number in 2014). While some of these charter schools outperform their public counterparts, many have done so through selective admission and expulsion. Public schools serve a disproportionate number of students from low-income families and students with special needs. Now, more than ever, a college degree is a prerequisite for employment and well-paid work, but a shrinking portion of students enters conventional place-based, four-year programs. Many high school graduates go on to two- or three-year community college programs, supplemented by online courses and other forms of “microcredentialing” in order to avoid the crushing burden of student loan debt.
Transportation is safer, more affordable, and more accessible. Self-driving technologies have matured, leading to a massive drop in private car ownership, a decrease in traffic fatalities and congestion, and revitalization of urban areas. Space previously devoted to parking lots and garages has been transformed into parks and other public amenities. On-street parking has been turned into dedicated lanes for a variety of smaller vehicles, including bicycles and electric scooters. Autonomous vehicles have increased the mobility of people with disabilities, the very old, and the very young—though that freedom of movement challenges businesses and public facilities to appropriately serve these populations once they have arrived.
Funding for human services, arts, and culture has continued to shift from government to private sources. Government funding for nonprofit organizations has continued its slow, decades-long decline. Changes to US tax policies have resulted in a 20 percent decline in charitable giving over the past three decades. So-called “impact philanthropy” has become the dominant guiding principle of individual and foundation funding, and nonprofits are expected to provide concrete, measurable data of how they have improved the environment or people’s lives in order to secure support. A growing number of foundations and individuals engage in “impact investing,” putting their money behind companies that deliver both financial and missionrelated returns. Socially responsible investing (SRI) is experiencing huge growth. In addition to traditional SRI funds consisting of for-profit companies that demonstrate responsible business practices, many financial management companies now offer funds that invest solely in benefit corporations—companies that are legally accountable for creating measurable social and/or ecological benefits as well as providing a financial return.
Climate change is gradually reshaping the world. Due in large part to limited implementation of the Paris Climate Agreement, by 2040 global temperatures have risen by an average of 3.6 degrees Fahrenheit above pre-industrial levels. Globally, sea level has risen an average of one-half foot, but the increase has been far worse in many places, including the US East Coast, where sea levels have risen a little over one foot. Miami, New Orleans, Jacksonville, Sacramento, and Virginia Beach have been hit particularly hard, as the land beneath these cities has sunk, compounding the effects of sea level rise. Many traditional agricultural crops have been disrupted by climatic change. Vermont no longer is known for its maple syrup, nor Georgia for its peaches. Across the Midwest the yield of commodity crops such as soybeans and corn has fallen steadily, leaving the US more dependent on food imports. There has been a modest increase in the adoption of alternative energy technologies, but overall the US is still heavily dependent on fossil fuels.
Signals
A selection of the sources we consulted for projections on how current trends are likely to play out by the year 2040.
On US population demographics
The US Census Bureau provides a wealth of fabulous data. It regularly issues reports projecting demographic change for a wide variety of parameters including age, sex, race, Hispanic origin, and nativity, factoring in variables such as migration, fertility, and mortality. See in particular Demographic Turning Points for the United States: Population Projections for 2020 to 2060. The Pew Research Center also reports on social and demographic trends, tracking trends related to marriage, parenthood, aging, income inequality, education, economics, and many other key issues.
On the rise of autonomous vehicles
In constructing this scenario, we looked to three sources of input on the future of self-driving cars: the public, producers, and pundits. A 2016 survey by the MIT AgeLab and the New England Motor Press Association found that while older drivers are not ready for full automation, almost a third of people under the age of 45 are open to the idea of completely autonomous vehicles. Manufacturers, who have a huge stake in getting this projection right, are placing their bets on the rapid adoption of self-driving technologies. A 2018 survey of the 11 largest automakers found they are all devoting significant resources to rolling out autonomous vehicles, with target dates ranging from right now to 2030. Academic researchers tend to be more pessimistic, but even a recent critical model found that self-driving vehicles might represent nearly 90 percent of private cars by 2045 if rapid price drops are paired with a rising willingness of Americans to pay for autonomy.
On economic stratification
Numerous publications document the rising inequality in wealth and income both globally and in the US, and explore the ramifications of this trend. For baseline figures, see the US Census Bureau summaries, visualizations, and data tools (of particular interest, the report Income and Poverty in the United States: 2017 For an overview of trends in inequality, see Deloitte’s issue brief, “Income inequality in the United States: What do we know and what does it mean?” (July 2017). Quantumrun, an agency that conducts long-term strategic forecasting for organizations, has published a special series devoted to the future of the economy, and in 2017 released a pithy analysis of wealth inequality. Pew Research reports explore how income inequality affects Americans differentially by gender, race, and ethnicity, and the compounding effect of the growing digital divide.
On the impacts of climate change and sea level
Credible, science-based climate models offer a range of possible outcomes for temperature and sea level. For this scenario we have chosen values from the mid-range of these projections. In 2016, research published in the Proceedings of the National Academy of Sciences (PNAS) projected how a 2-degree Celsius (3.6-degree Fahrenheit) temperature increase would affect global sea level and particular locations. A limit of 2 degrees Celsius is the goal of the Paris Climate Agreement, and the authors note that this threshold is likely to be reached between 2040 and 2050. We identified US cities at particularly high risk from rising tides using data in a paper that appeared in PNAS in 2015 calculating the effects of sea level rise on US cities with populations of over 100,000. Data from research projects such as these undergird the interactive, online tools created by the nonprofit Climate Center (climatecentral.org), and we encourage planners to use these tools to explore a range of possible outcomes for their own locality.
Discussion Guide
Reality Check
Opinions may vary regarding what constitutes a trustworthy source for “credible, mainstream projections” about the future. To moderate such discussions in your own organization, it may help to start by establishing the criteria you will use to evaluate the credibility of published research. The European Association for International Education recommends a framework of eight questions, including: Why was the study undertaken? What is the reputation of the organization and individuals who conducted the research? What were the methodology, sample size, and response rate? And (perhaps most revealing) who paid for the research?
Desirable/Undesirable
Unlike the first two scenarios in this set, “Equilibrium” isn’t based on judgments about what would constitute a good or bad future. The scenario does not reflect museum people’s hopes or fears but simply tries to present what is likely to happen given current trends. That said, some early readers observed that “Equilibrium” sounds uncomfortably dystopian. You may agree or disagree! After your planning team edits the scenario as needed to reflect their vision of a probable future, discuss which aspects of the scenario are welcome and which are undesirable.
Museums in This Future
In 2017 a special issue of Museum magazine explored the implications this scenario holds for museums. (Museum 2040 is available as a free download from the Alliance website.) Contributors were invited to submit articles, opinion pieces, and news items that illustrate how museums have managed to thrive in this version of the year 2040. The narratives they came up with include:
- The rise of hybrid organizations that serve many roles for their communities. Many museums incorporate libraries, preschools, parks, houses of worship, or health centers into their operations.
- Museums serving as hubs for a generation of New Creatives—people displaced from traditional employment who, subsidized in part through the Universal Basic Income Act of 2033, redirect their time to creative pursuits.
- A new category of AAM accreditation that credentials the entire cultural landscape of a city, town, or region. This certification recognizes the successful collaboration of an area’s museums with government, school system, libraries, and relevant arts, culture, and heritage/history nonprofits.
Use this issue of the magazine to inspire stories of your own.
From Insight to Foresight
Exploring scenarios helps us future-proof plans by asking, “In this future, how would I/my family/my community/my museum thrive?” By answering this question across several scenarios, you may identify actions that would be beneficial in a variety of circumstances.
In this future I might:
In this future my organization might:
From Foresight to Action
Remember that “probable” does not mean “inevitable.” The most important part of this exercise is discovering how you can build the future in which you want to live. After you have tweaked this scenario to reflect a future you believe is probable, identify what parts of that future are desirable, and which you hope will never come to pass. Based on that assessment, work on the following questions:
To improve the probable future I might:
To improve the probable future my organization might:

Upcoming Events
-
Planning and Budgeting for Fundraising Success – OMA Webinar
Event Date:Presented by: Ohio Museums Association -
AASLH History Hour: Civic Practice
Event Date:Presented by: American Association for State and Local History (AASLH) -
What It’s Like to Participate in Museums Advocacy Day
Event Date:Presented by: American Alliance of Museums -
From Idea to Acceptance: How to Submit a Winning Annual Meeting Session Proposal
Event Date:Presented by: American Alliance of Museums